TABLE OF CONTENTS
- Recalculate analyses
- Reload analyses
- Filter and search analyses
- Use analyses to create reports
- Exporting analyses as an Excel list
To view analyses, click "My Analytics" under "Analytics" in the TabTool menu.
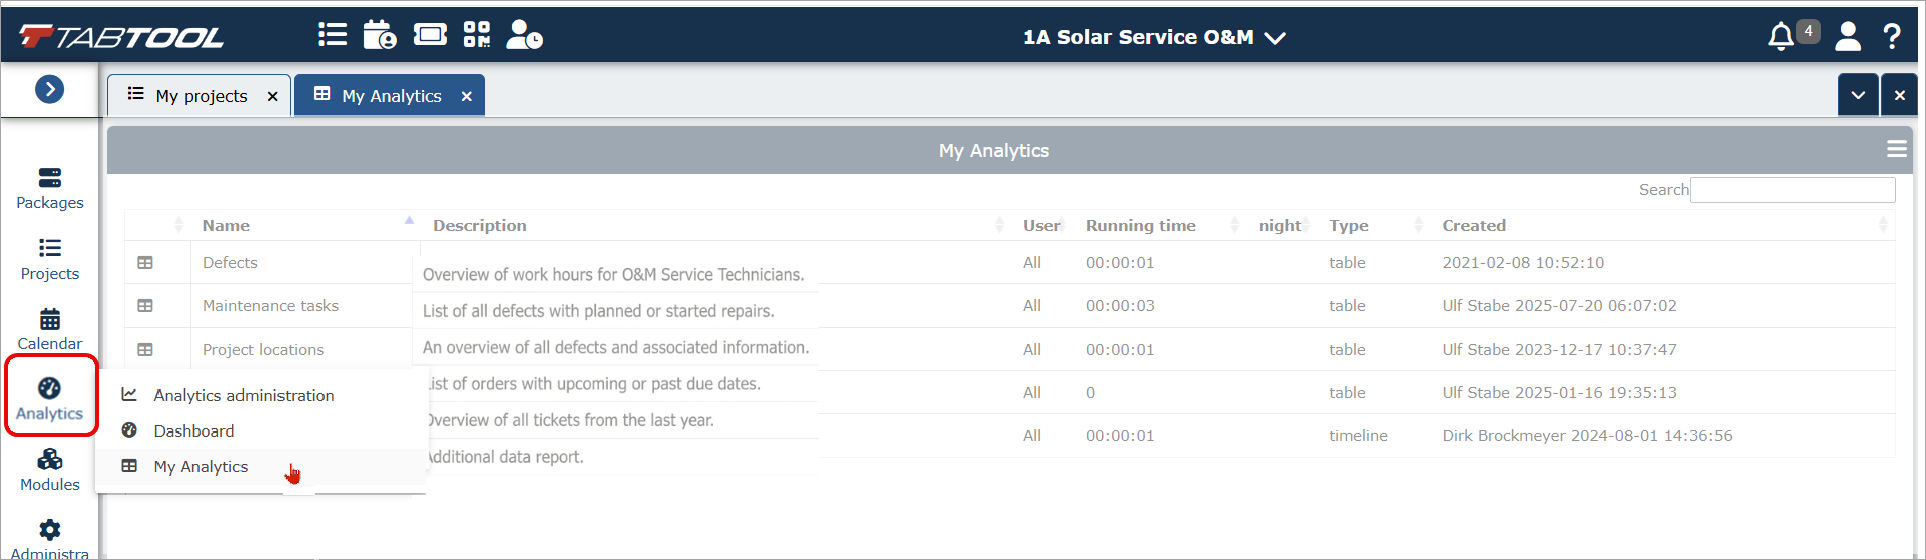
You will be taken to a list of your existing analyses. Click the list entry of the analysis you want to view. The analysis opens in a new tab.
In the analysis view, depending on the analysis type, you can perform various actions and configure settings to adapt the analysis to your needs. The following explanation uses the most commonly used analysis type, "Table (values)", as an example.
Recalculate analyses
In the configuration menu of an analysis (Menu "Analytics administration") you can use a checkbox to define whether an analysis should be recalculated automatically every night.
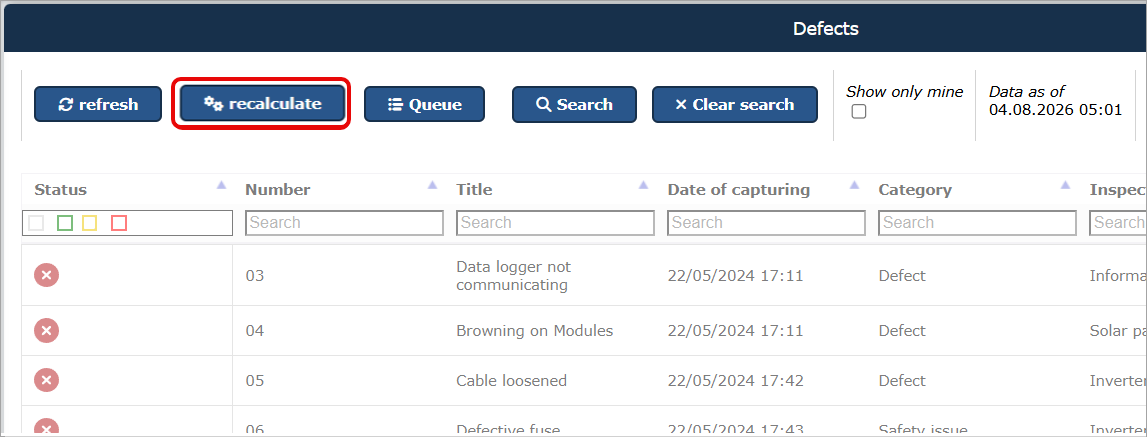
If automatic recalculation is not activated, you can trigger the calculation of a tabular analysis manually using the "recalculate" button.
Manual recalculation can also be useful during the course of a working day if new records have been created, status values have changed or other relevant data has been updated since the last calculation.
You can see the time of the last recalculation of an analysis in the information "Status as of day.month.year xx:xx" above the table.
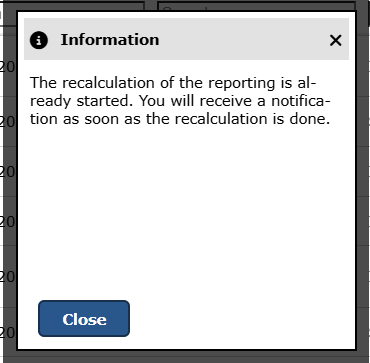
As recalculating an analysis can take some time, depending on the amount of data, notification windows provide information about the calculation status.
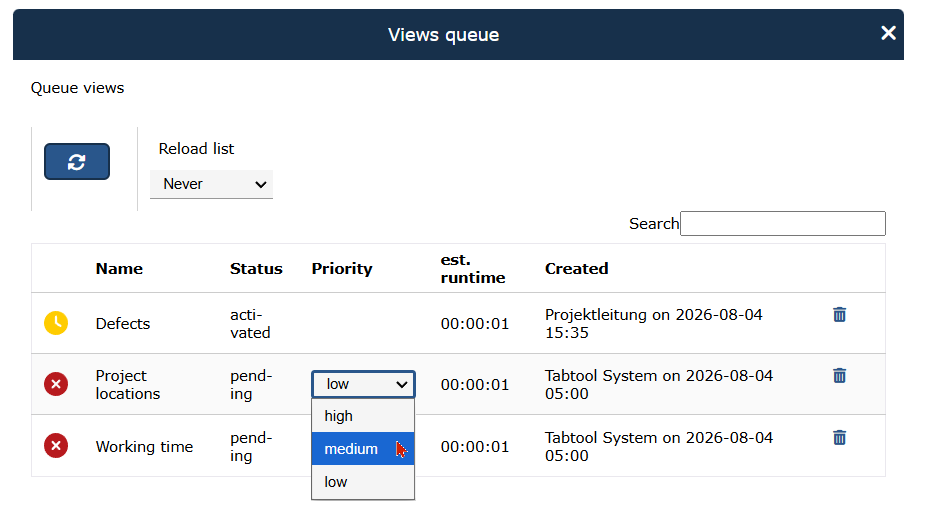
If you trigger the recalculation of several analyses and want to keep track of them, you can use the button to display an overview of the recalculation status.
Here you can also prioritise individual analyses during recalculation.
Reload analyses
If you leave an analysis open in a browser tab for a longer period, it can be useful to reload the view, for example at the start of a working day or after manually triggering a recalculation.
To do this, click the "refresh" button or use your browser's reload button.
After reloading, the most recently calculated status of the analysis is displayed in the browser. This, however, does not start a new calculation of the underlying data.
Filter and search analyses
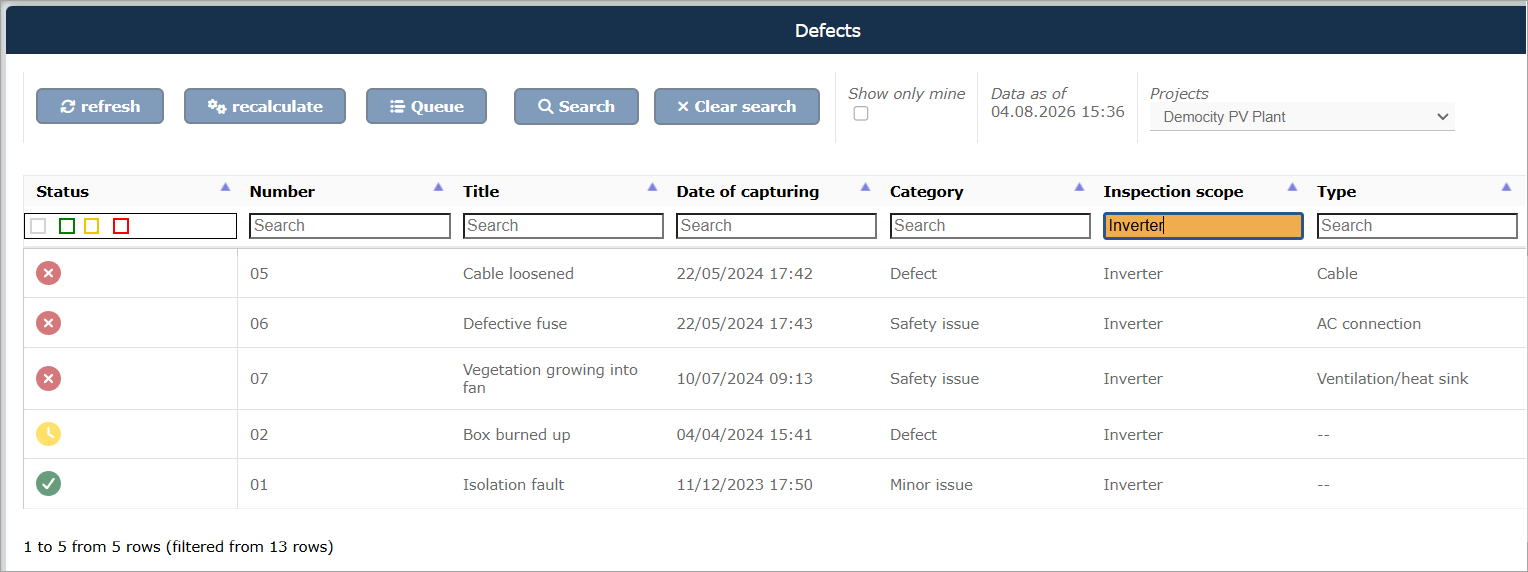
Analyses of the type "Table (values)" can be filtered and searched in various ways.
By activating the "Show only mine" checkbox above the table, you can restrict the data in the table to those records, such as orders or defects, for which you are assigned as the responsible person.

Using the "Projects" drop-down selection, you can also restrict which projects should supply data to the analysis.
Additional filter options are available in the search row directly above the table columns. There you can search individual columns for specific values and filter the displayed results accordingly.
Please note that the column filters are combined with each other: each entry further restricts the displayed table entries. If you enter search terms in several columns, only entries that meet all set filter criteria are displayed.
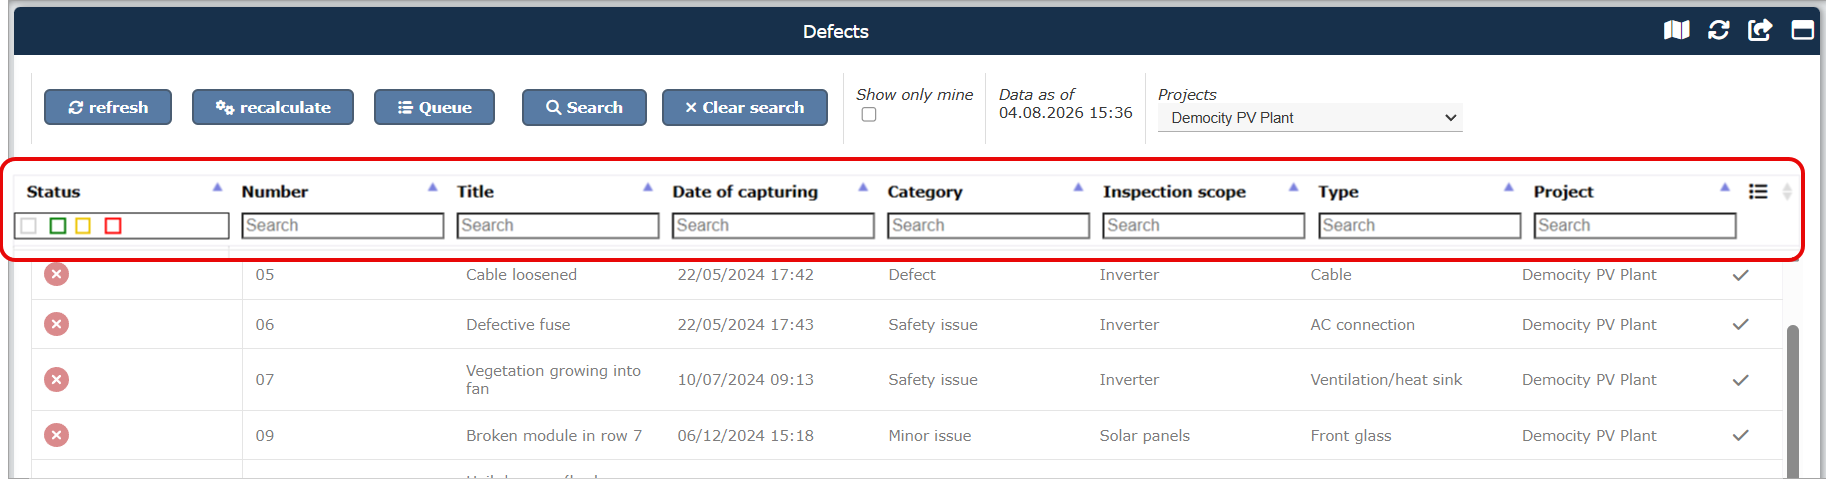
Please note: While the status column responds directly when one of the checkboxes in the search field is activated or deactivated, entries in the search fields of the other columns must be confirmed with "Enter" or by clicking the "Search"  button to start the search.
As soon as a search filter is active in a column, the corresponding search field is highlighted in colour. The highlighting indicates that the displayed results are restricted by a filter.
Removing search filters
To remove all active filters in the table columns, click the "Clear search" button. If you do not want to remove all filters but only individual ones, delete the entered value in the search field of the corresponding column and confirm the change with "Enter".
In the status column, you can remove individual filters by deactivating the corresponding checkbox.
Use analyses to create reports
Tabular analyses are particularly useful for creating cross-project reports. The project, search and column filters that have been set determine which records are included in the report.
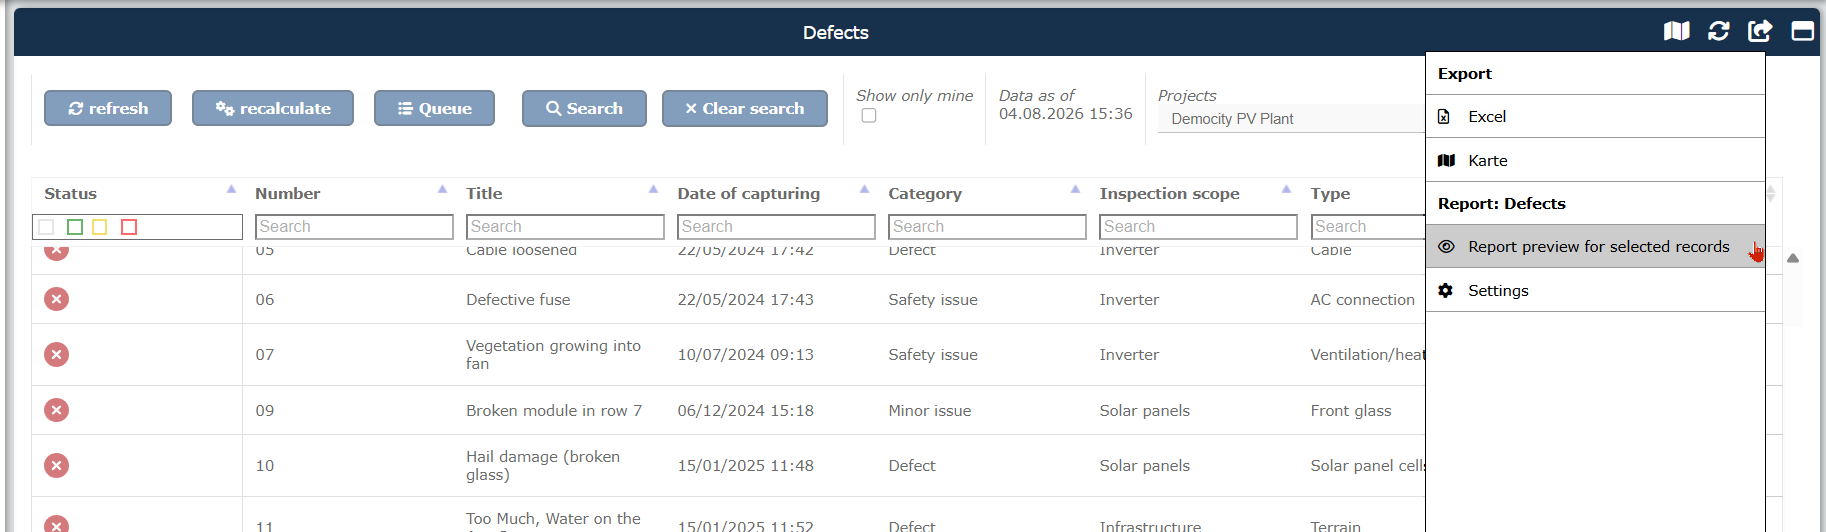
To create a report from an analysis, click the "Share" icon  at the top right of the analysis header. In the menu that opens, click the option "Report preview for selected records".
Note: This function is not available for all analyses. You can only create reports from analyses that are based on a single record type. Reports cannot be created from analyses that contain data from several different record types.
Further details on creating reports based on analyses: Projektübergreifende Berichte erstellen.
Exporting analyses as an Excel list
Using the "Share" button at the top right of the analysis header, you can export the displayed data in Excel format. Clicking the "Excel" row starts the file download automatically.
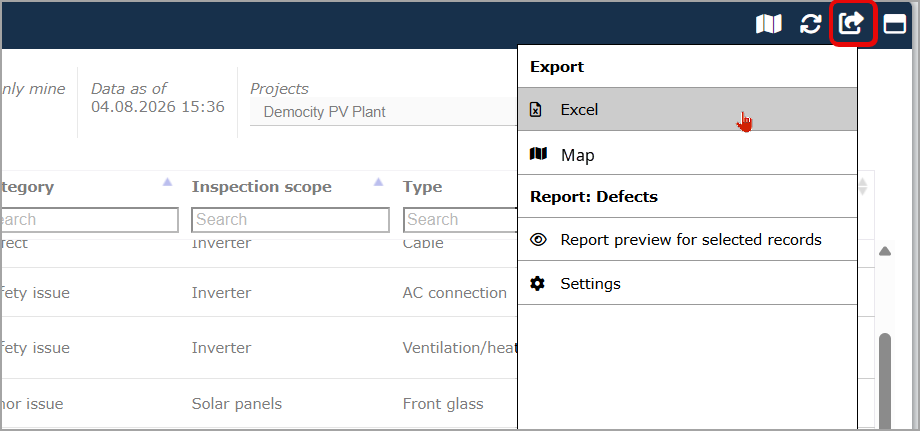
The export will contain the currently displayed data, restricted by any active filters.
RELATED HELP ARTICLES
Was this article helpful?
That’s Great!
Thank you for your feedback
Sorry! We couldn't be helpful
Thank you for your feedback
Feedback sent
We appreciate your effort and will try to fix the article