When creating or editing a tabular analysis, you can define additional settings for each column. These settings are optional and are only needed if you want to adjust the display, sorting or pre-filtering of individual columns in more detail.
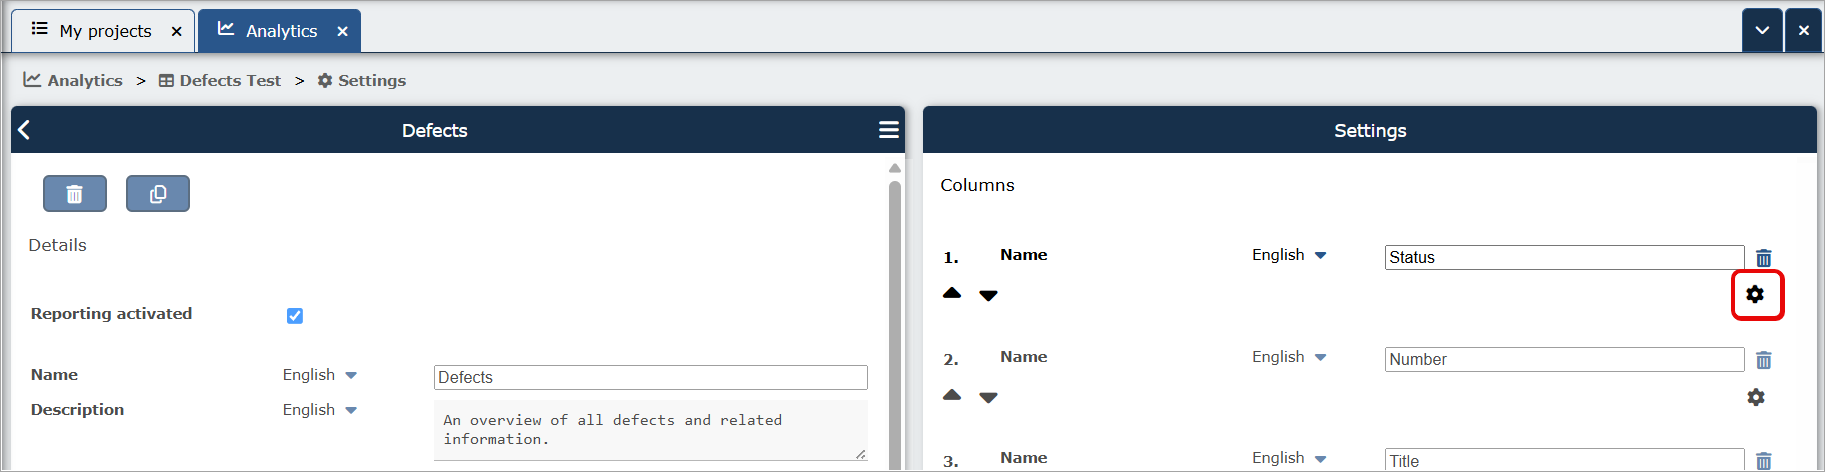
To open the advanced settings for a column, click the settings icon for the relevant column in the "Columns" section.
Define the sort order

Using the "Sort order" setting, you can define ...
- at which position the column should be considered in the sorting, for example as the first or second sort column. You can set this using the arrow buttons

- whether the sorting should be in ascending or descending order.
This setting is particularly useful if the entries in the analysis should already be displayed in a specific order when the analysis is opened, for example by status, date or project name.
Set an initial filter
Using an "initial filter", you can define that the analysis is already filtered by specific values when it is opened.

Depending on the column type, different selection options are available. For a status column, for example, you can define which status values should be displayed when the analysis is opened.
Initial filters are applied when the analysis is loaded. Users therefore initially only see the entries that match the predefined filter criteria. The filters can be adjusted or removed in the opened analysis if required.
Use a column for the map view
If an analysis is also to be displayed as a map, you can define for individual columns whether their contents should be used in the map view.
Two options are available for this:
- Map short text: The content of the column is used as brief information in the map view.
- Map long text: The content of the column is used as more detailed information in the map view.
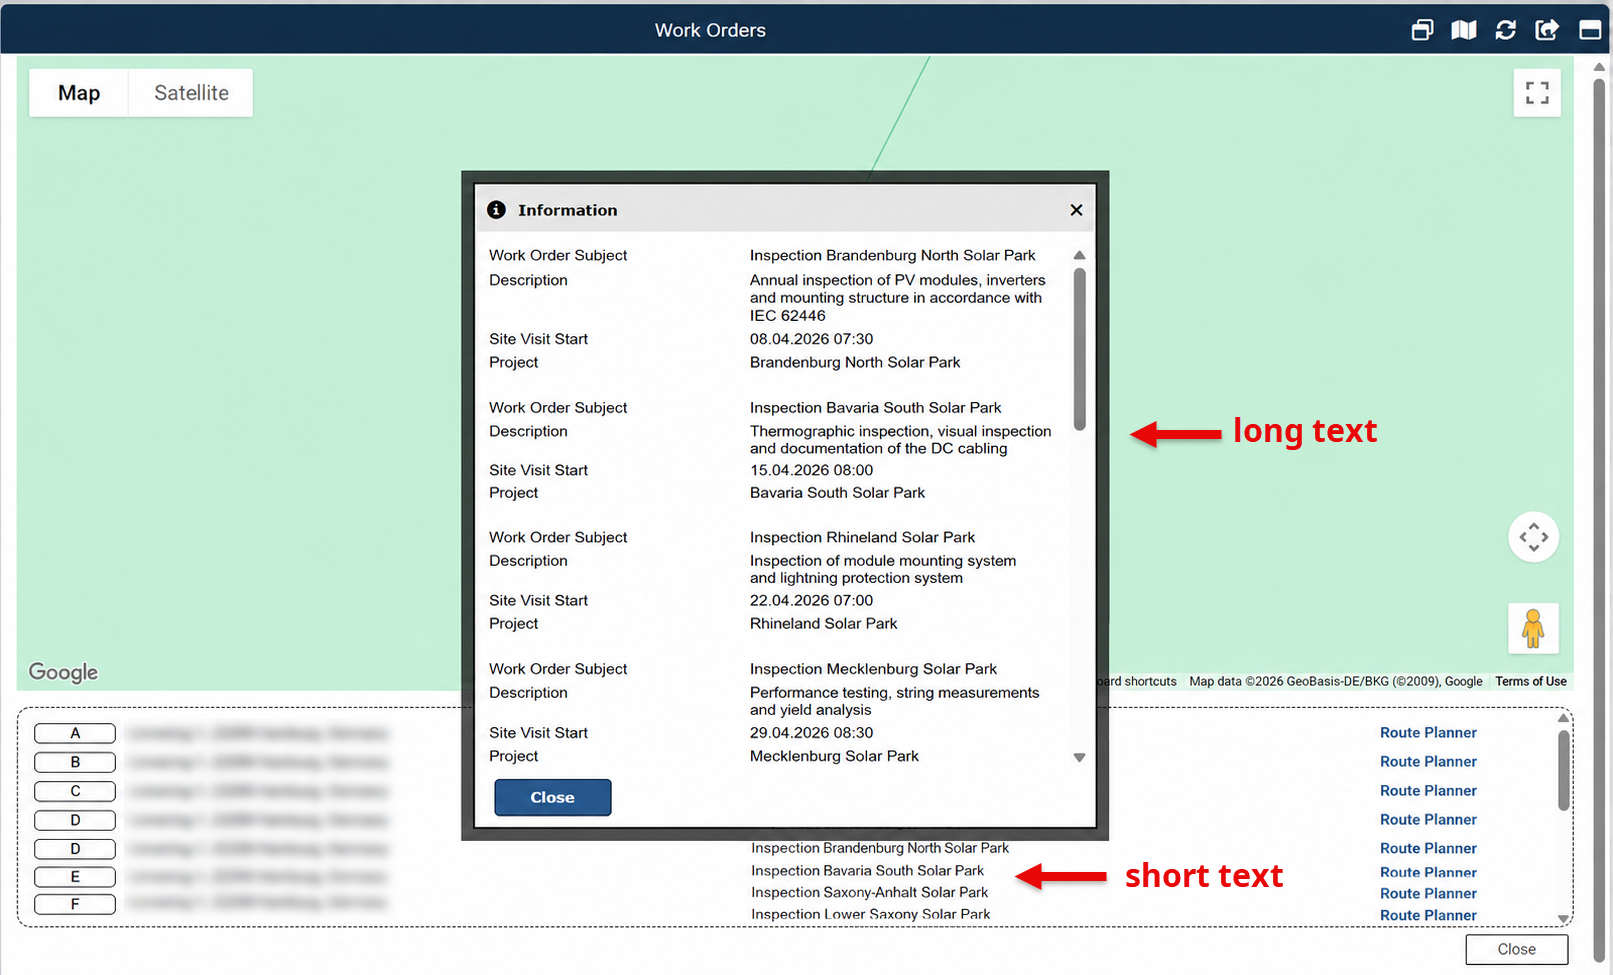
These settings are only relevant if the analysis is also used in a map view.
Define the responsive priority
Using the responsive priority, you define how important a column is for the display on smaller screens.

Columns with a high priority are displayed preferentially if there is not enough space for all columns. Columns with a lower priority may instead be hidden sooner or displayed with lower priority.
This setting is particularly useful if analyses should also be displayed clearly on smaller screens or in the TabTool app.
Define the date format
For columns with date values, you can select a date format. This defines how dates are displayed in the analysis.
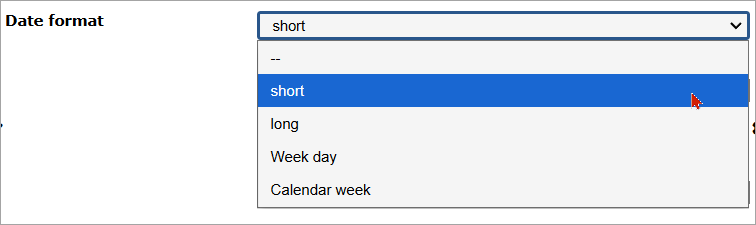
This setting is useful if dates should be displayed in a specific format, for example Weekday + Date (long format), just the date (short format) just the weekday or the calendar week.
Was this article helpful?
That’s Great!
Thank you for your feedback
Sorry! We couldn't be helpful
Thank you for your feedback
Feedback sent
We appreciate your effort and will try to fix the article