TABLE OF CONTENTS
View, filter and recalculate analyses
- Recalculate analyses
- Reload analyses
- Filter and search analyses
- Use analyses to create reports
- Exporting analyses as an Excel list
Analyses allow you to analyse data across projects in TabTool and display it clearly in one central place. Using various filter and search functions, you can narrow down the displayed data in a targeted way and evaluate it quickly.
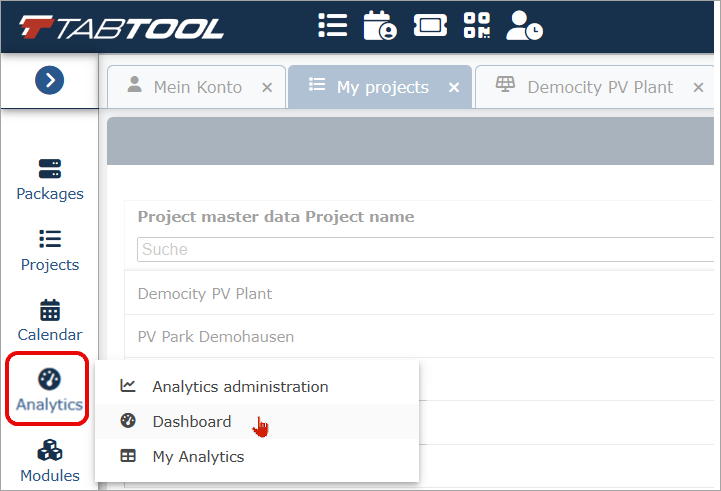
To create and edit analyses, log in to the TabTool Office web application. In the left-hand menu bar, click "Analytics" and then "Analytics administration".
Important: Your TabTool user account must have permission to create analyses. You can find out how to check and change these permissions here: How to set user roles and permissions.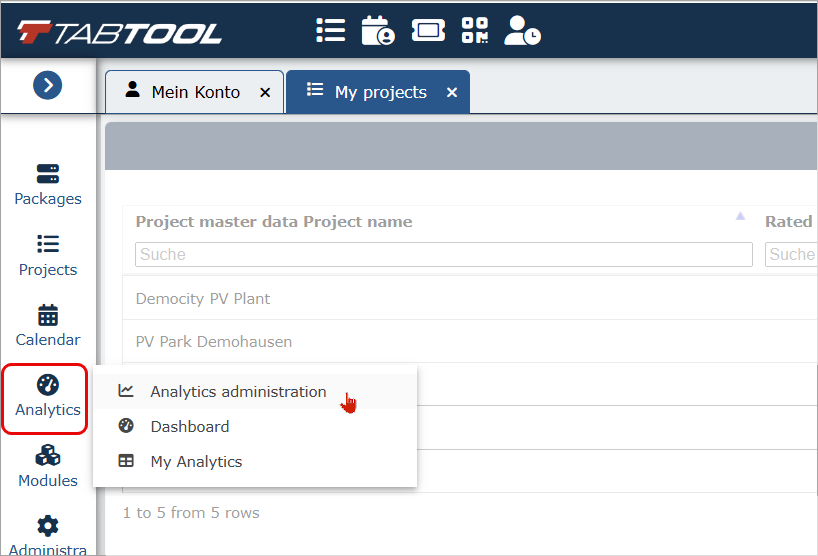
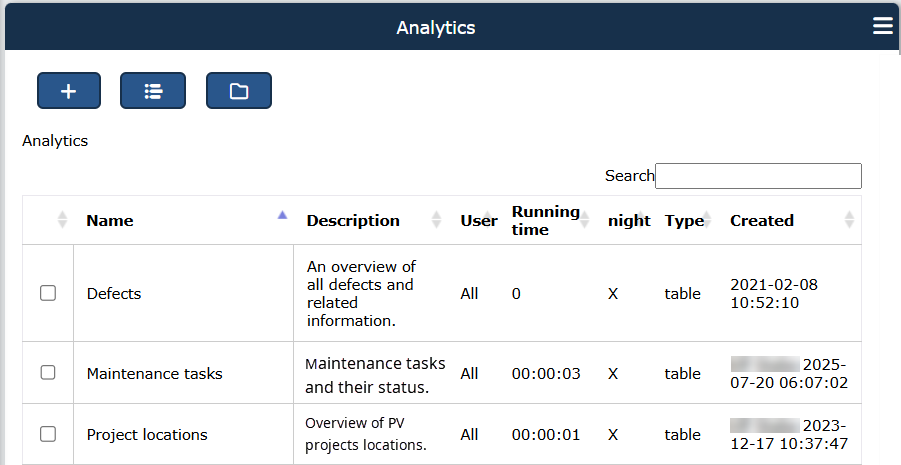
You will now see a list of the analyses that already exist in your package. This list will usually not be empty, as TabTool provides several predefined analyses.
Create a new analysis
To create a new analysis, click the "+"  button above the list of existing analyses.
In the input window that opens, you can enter a name for your analysis and select the required analysis type.
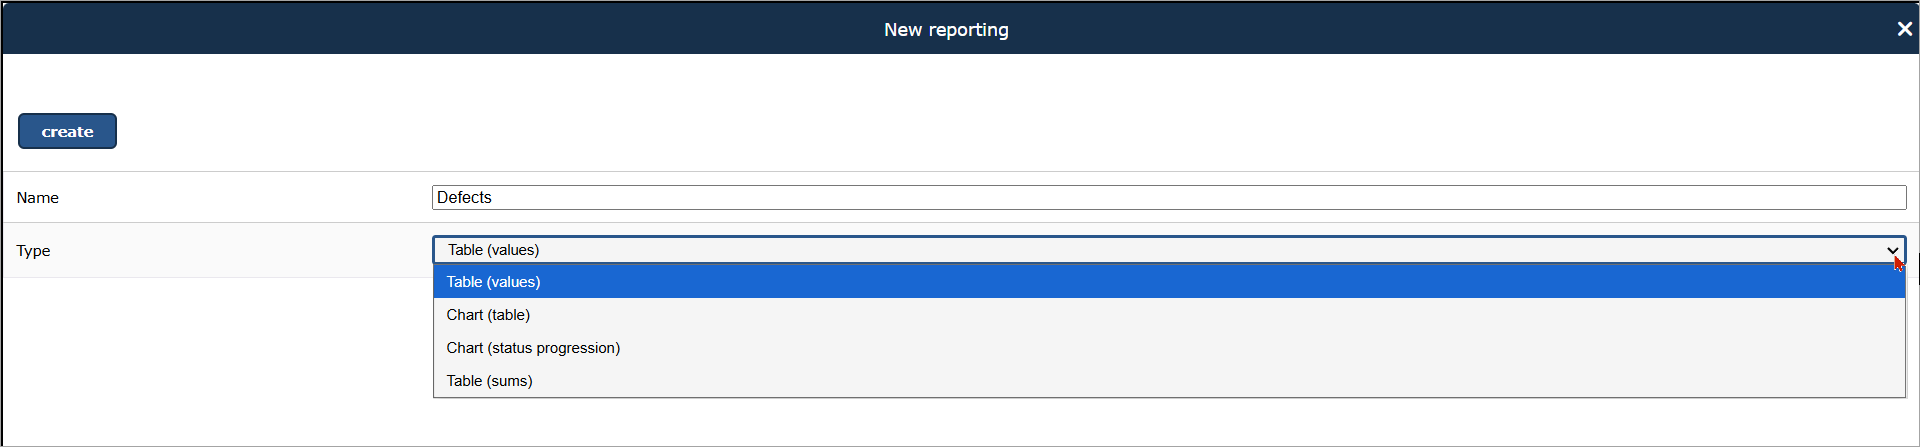
You can choose between the following analysis types:
Table (values)
Table (values) This analysis type displays data clearly in tabular form. The analysis can be created for a specific record type, such as defects, or across multiple record types, such as different order types. You can freely define the content and order of the columns.
Example:
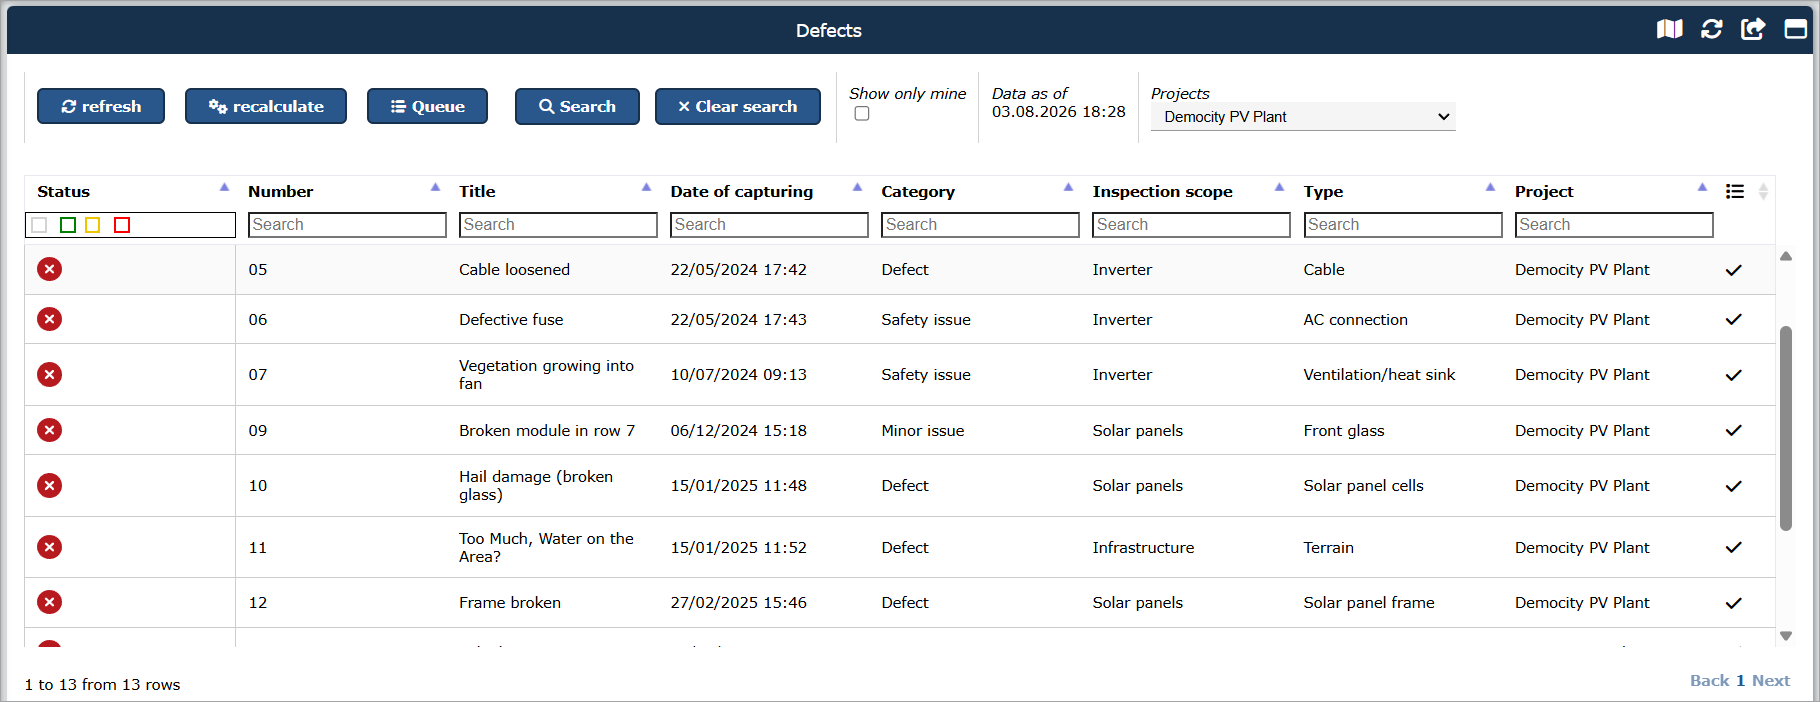
Table (sums)
This analysis type calculates totals based on the data of a record type.
Example:
- Number of defects by status, for example how many are red, yellow, green or grey
- Number of defects by category, for example observation, defect, safety-relevant or for information
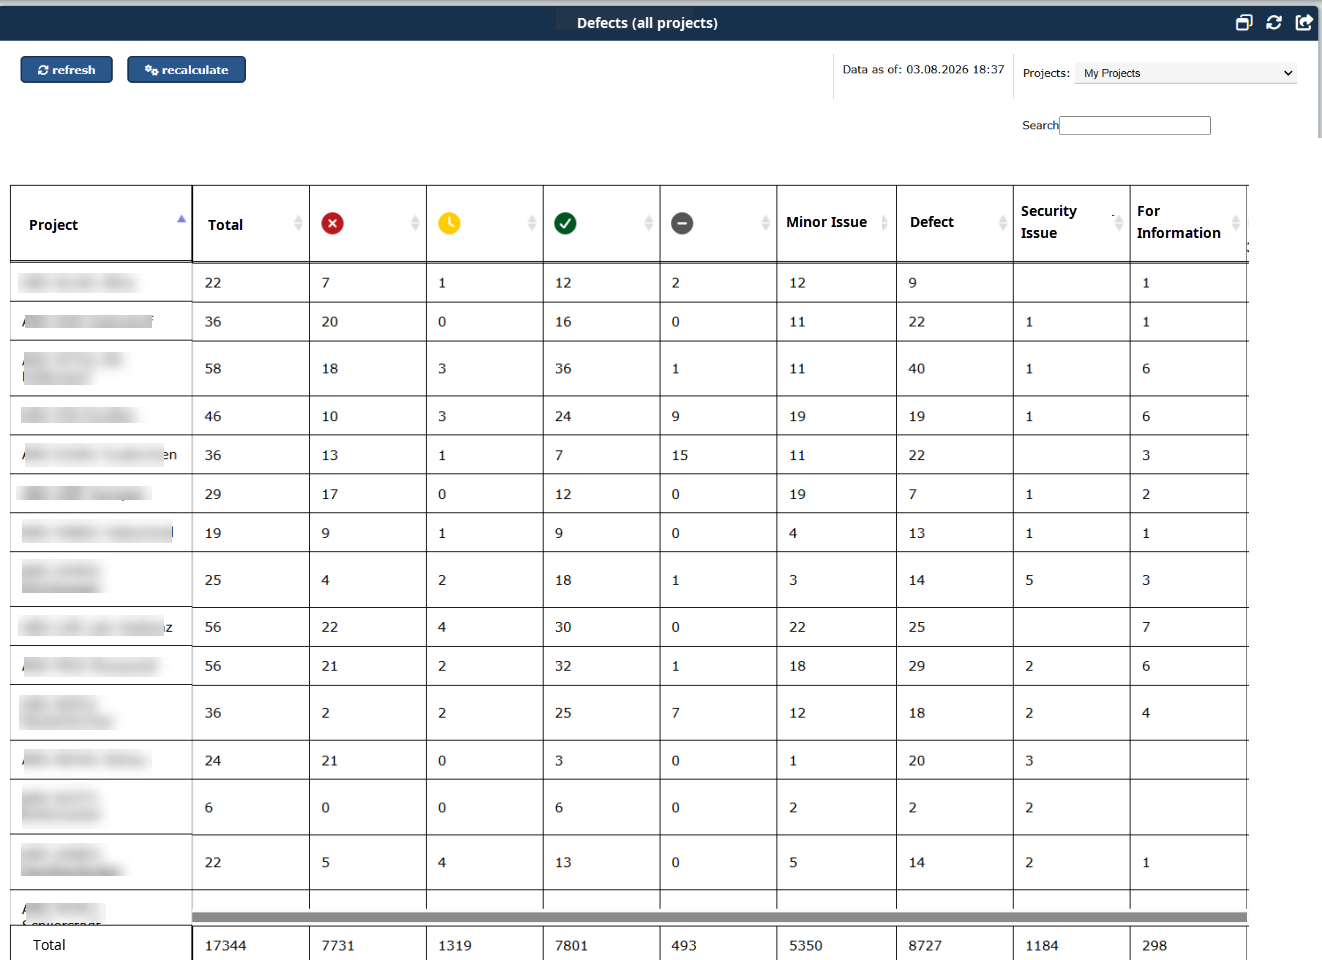
Chart (table)
This analysis type presents data from a record type in graphical form. The underlying table values are summarised according to freely selectable criteria and displayed as a chart, for example as a bar chart. You can define which values are analysed and by which attributes they should be grouped.
Example: Number of defects per year, broken down by inspection area.
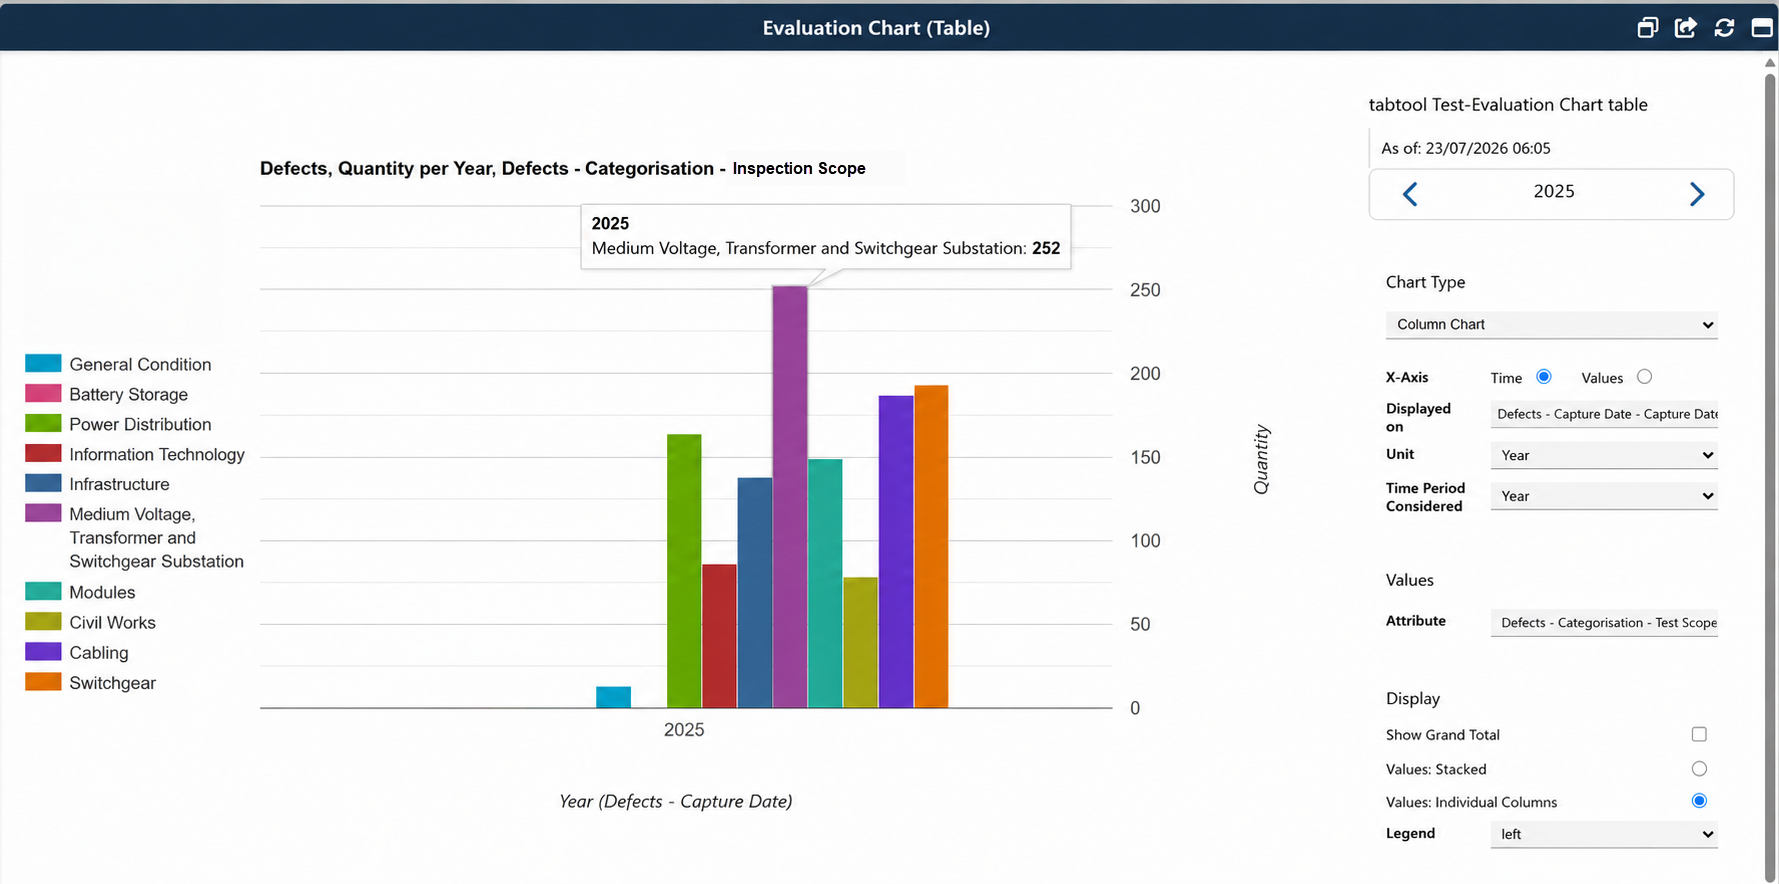
Chart (status progression)
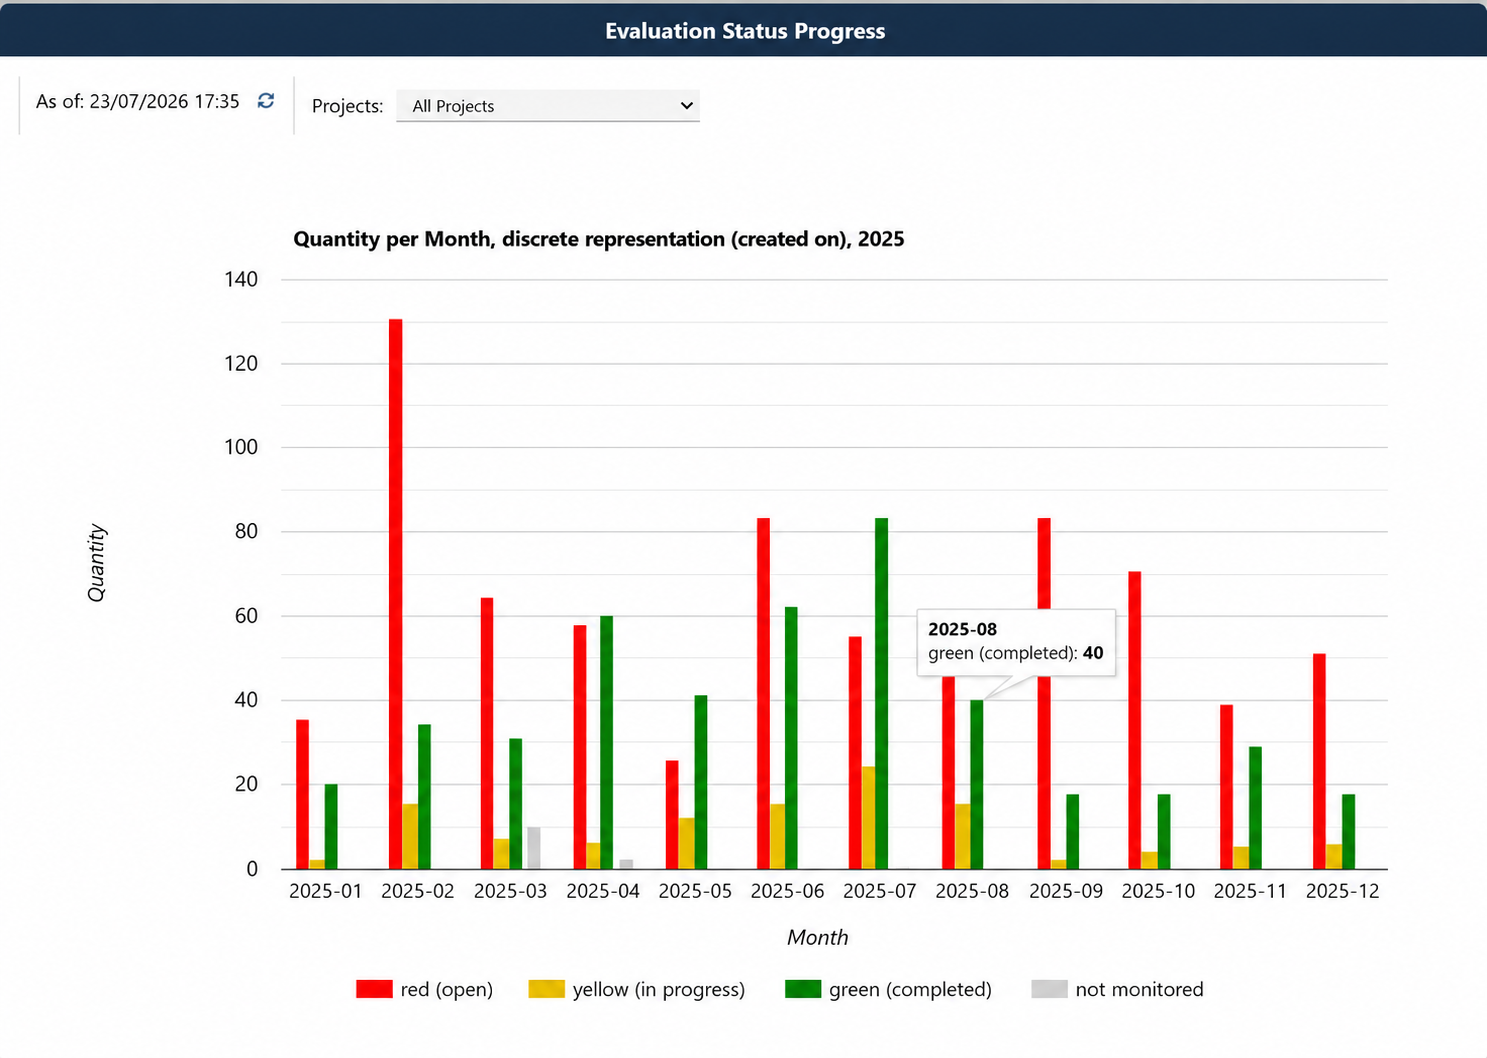
This analysis type visualises how the status of records develops over time. This allows you to see at a glance how open, in-progress or completed items are distributed over a specific period.
Two display options are available:
- Discrete view (created on): The records are grouped by their creation date. This shows the current status of the records created within a specific period. For example, you can identify whether defects from an earlier calendar week are still open and require further action.
- Continuous view: This displays the status development of all records over the selected period. It enables a continuous view of work progress and the development of open, in-progress and completed items.
Example:
Configuring the analysis
The following steps for creating an analysis are described using the analysis type "Table (values)", as this is the analysis type most commonly used by our users.
Tip: Instead of creating an analysis from scratch, you can copy an existing analysis and use it as a template. To do this, click the copy buttonfor the required analysis and then adapt the copied analysis to your need.
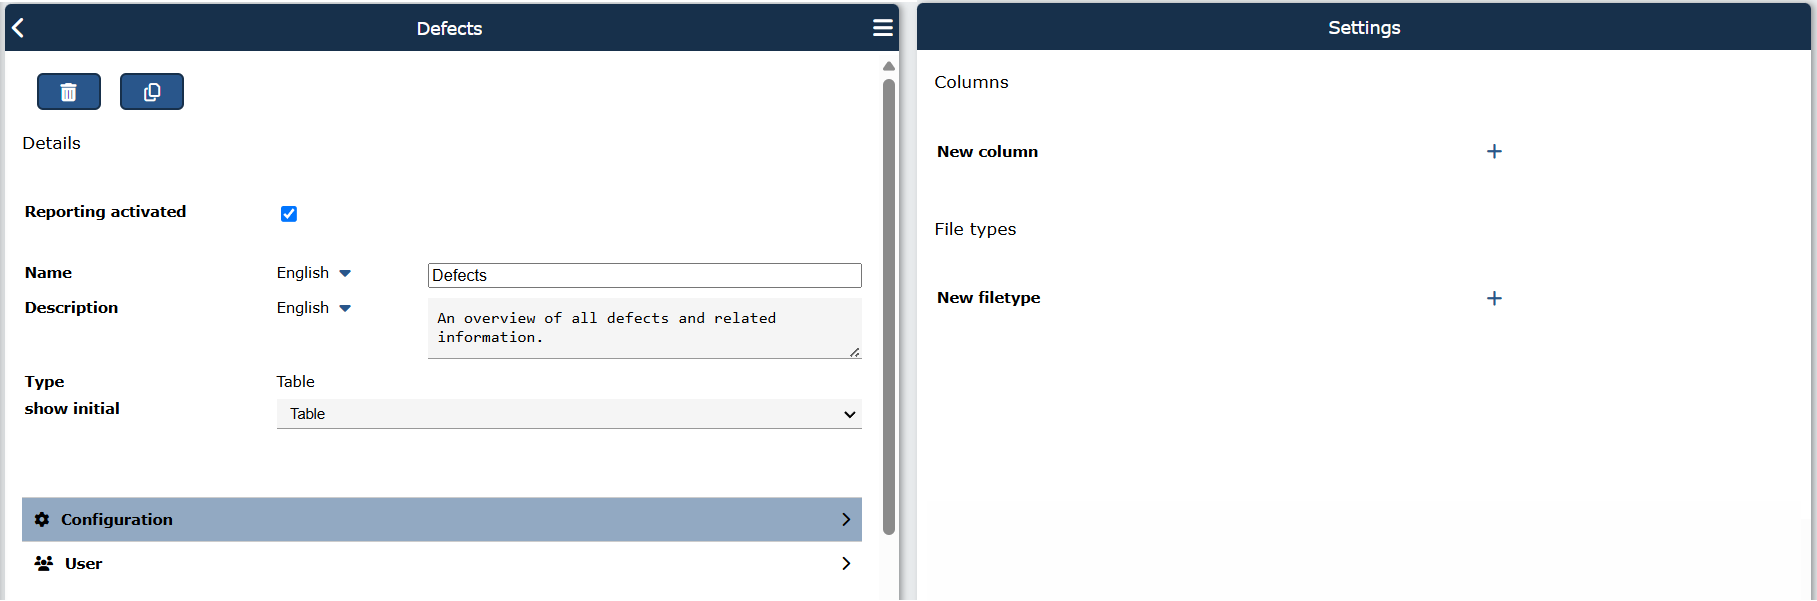
After you have created a new analysis using the "+"  button, selected the analysis type, you can enter a description for the analysis in the next step. This description will later be shown in the overview of your analyses.
Then click the "Configuration" row to set up the analysis.
Configure columns
First define the number and names of the columns your analysis should contain.
Clicking the "+" button in the "New column" row opens an input window where you can enter the name of the first table column.
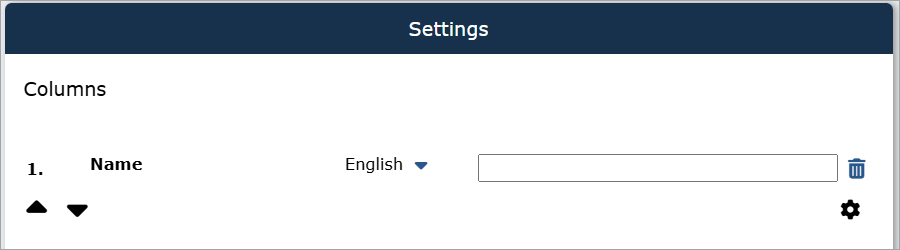
Repeat this process until you have created the required number of table columns.
You can use the arrow buttons  to adjust the order of the columns by moving individual columns up or down.
Click the button if you want to define further settings for columns, for example to set the date format or define an initial filter.
Example:
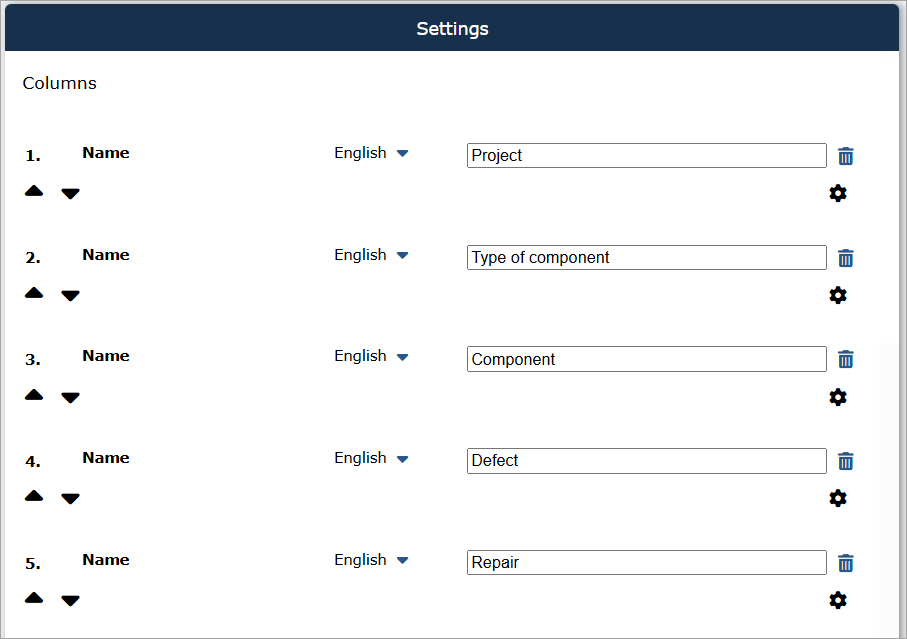
We want to create an analysis that shows, across projects, all defects on specific components of a solar park, namely inverters and transformers, as well as their repairs.
To do this, we create the following columns:
Define filetypes
In the next step, you define which filetypes should provide data for the analysis and which attribute, meaning a field in the form of the filetype, such as in the defect form, corresponds to which column in the table.
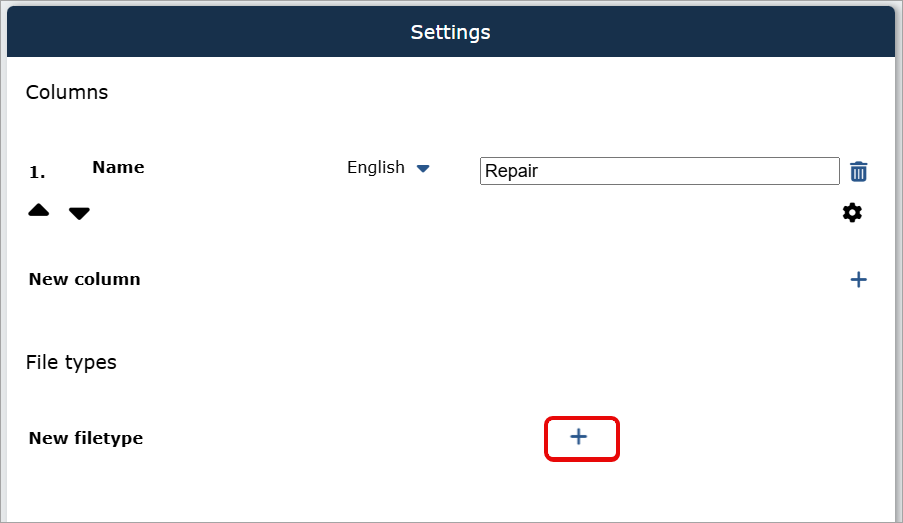
Clicking the "+" button in the "New filetype" row opens a drop-down menu containing all record types available in your TabTool package. These may include orders as well as defects, components, checklists and contacts, for example.
For our example, we select the record type "Defect (PV)".
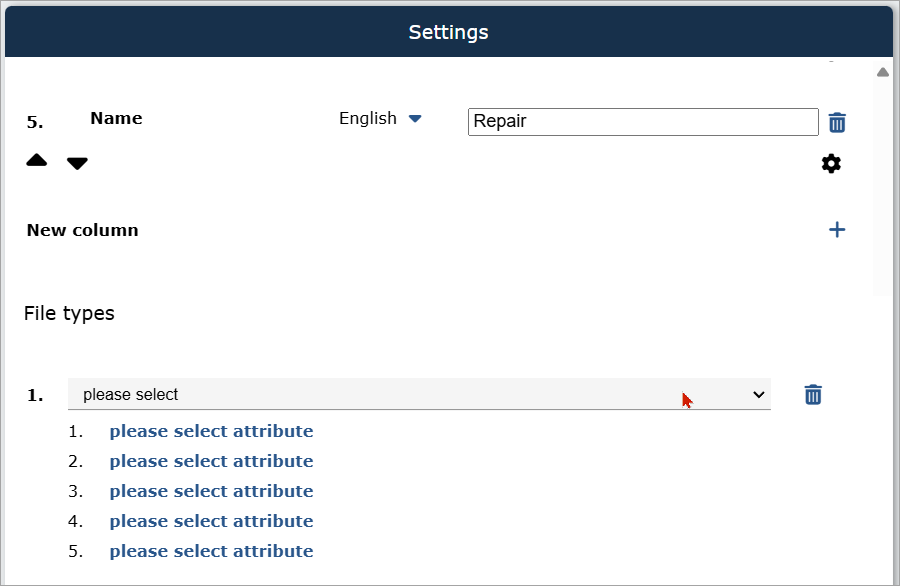
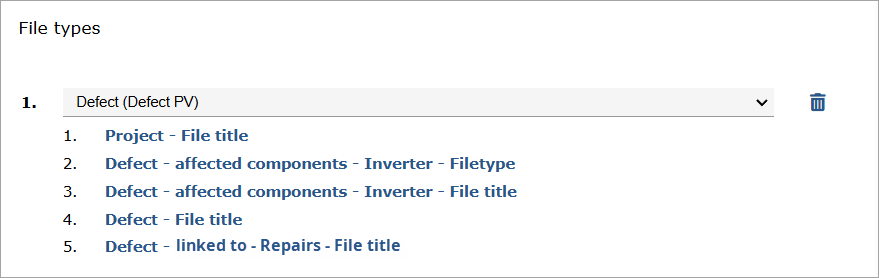
You can then select an attribute for each of the columns created previously. This attribute, meaning a form field in the file, provides the data content for the respective table column. Make sure to assign the attributes in the same order in which you previously defined the columns.
The selection list that opens when you click "please select attribute" is structured as follows:
- First, all fields (attributes) included in the form of the record type are listed, such as record title, status or subject. Individual metadata fields for the record are also available as attributes, such as the creation date ("Created") and the last modified date ("Modified").
- Below this, you will find the names of the record types that can be linked to the selected record type, such as the components to which a defect can be assigned. Clicking one of these names opens the list of all fields included in the corresponding record type.
- Finally, the project is listed as the parent record. Clicking "Project" opens a list of the fields in the project file. For cross-project analyses, the field "Project - Record title" is often used, for example. It shows to which project a file listed in the analysis is assigned.
For our example, we first assign the following attributes relating to the component "Inverter" to the five columns of our analysis.
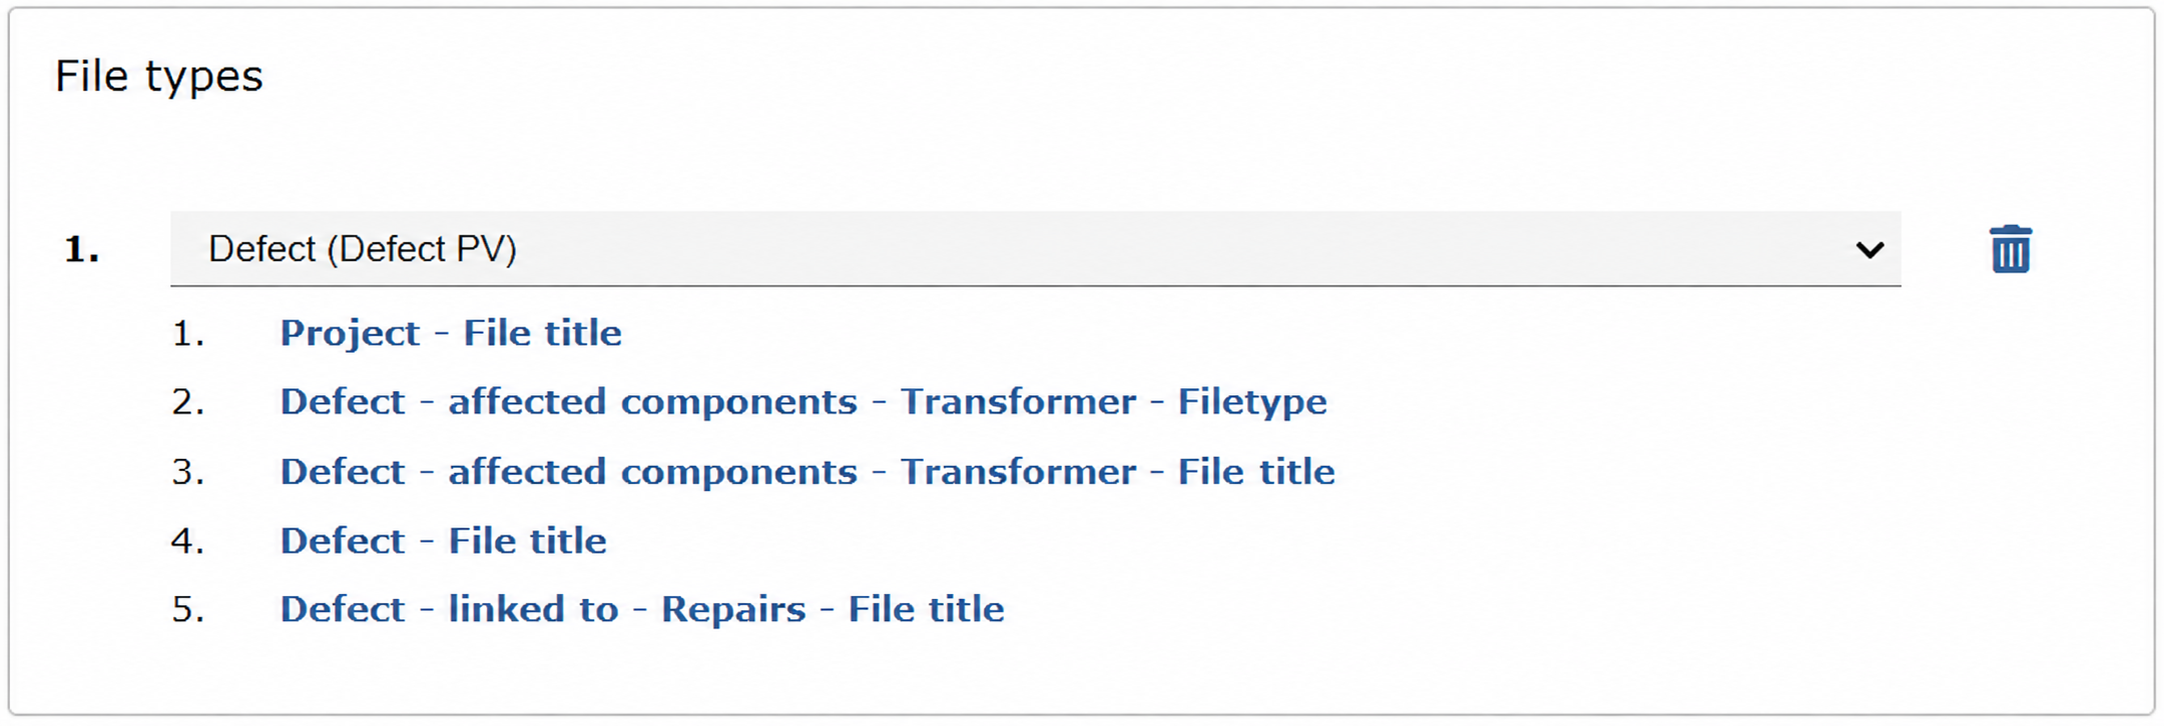
We then repeat the attribute assignment for the component "Transformer".
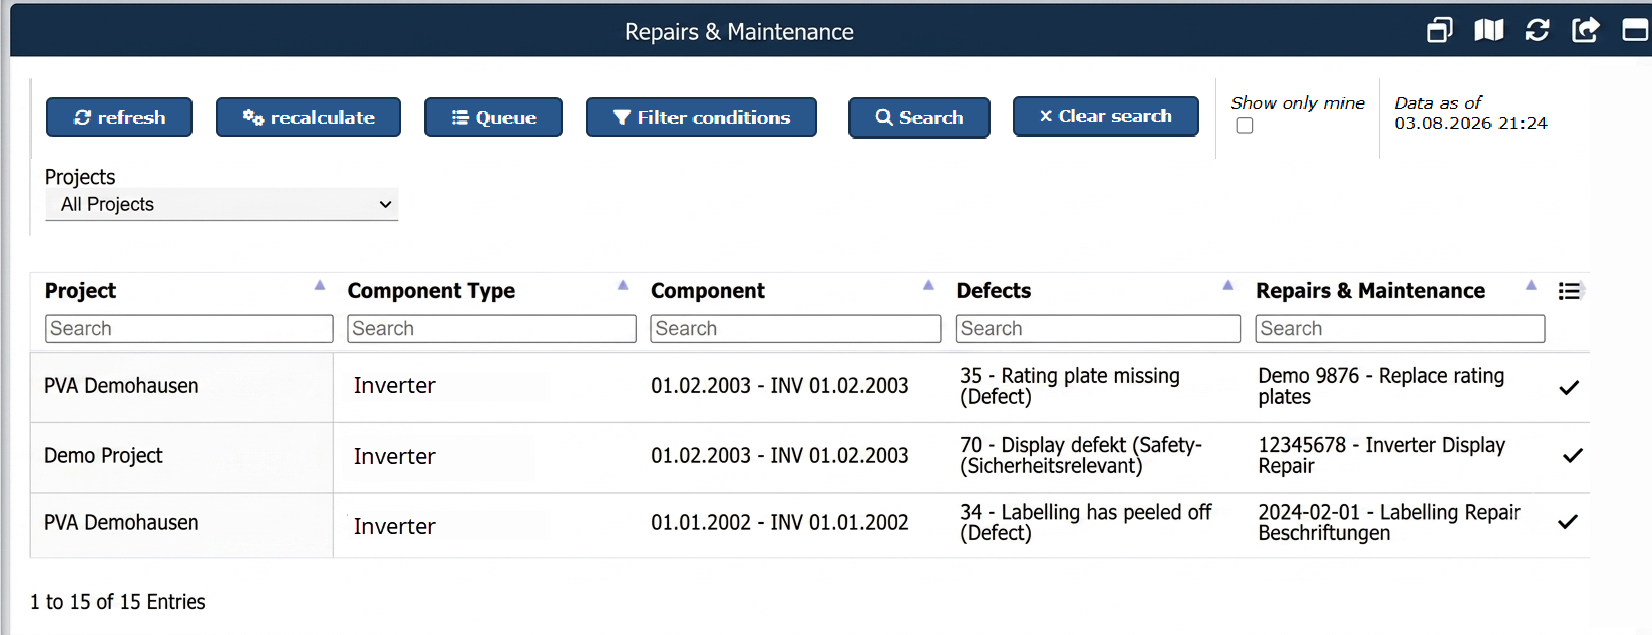
The finished analysis looks like this:
Set filters (optional)
After selecting one or more filetypes and the corresponding attributes, you can set a filter for each filetype.
These filters already define during configuration which files are generally included in the analysis. They are therefore different from the search and column filters that can later be used in the opened analysis.
To define a filter, click the "New filter" button.
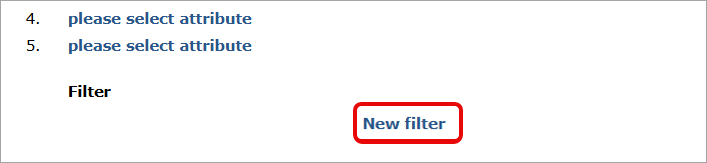
An input form opens. First select a field (attribute) from the previously defined filetype to which the filter should refer.
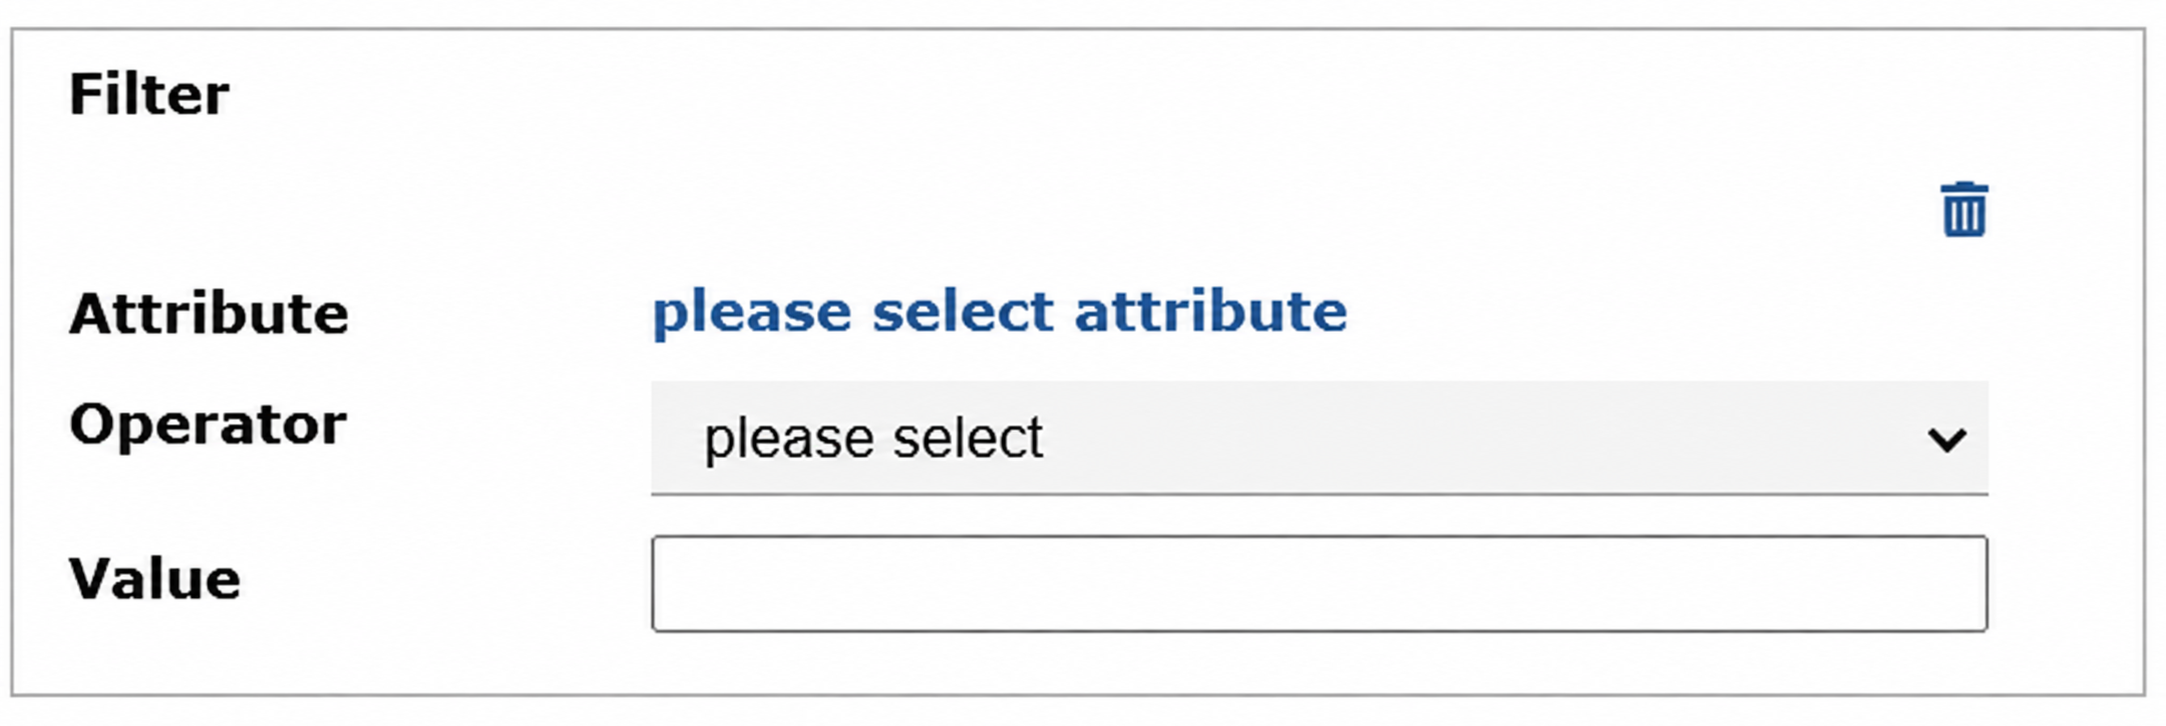
Then use the "Operator" and "Value" fields to define the restriction that the filter should apply.
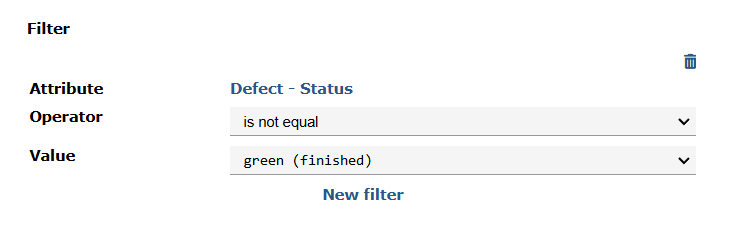
Example:
If you only want to see defects in your analysis whose processing has not yet been completed, you could set the following filter for the record type "Defect":
Users, activation and additional settings
After defining the content of an analysis by using columns and attributes, you can configure additional settings in the left-hand column of the configuration menu.
Activate analysis
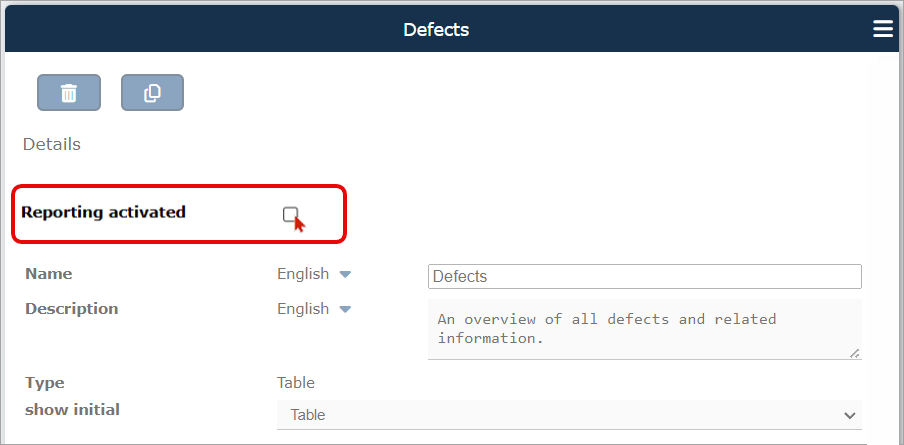
Important: After configuring a new analysis, you must activate it using the checkbox in the left-hand column, above the analysis name and description. The analysis will only be calculated and displayed once it has been activated.
Initial display (table oder map)
Directly below the input fields for the name and description of your analysis, you can define how your analysis should be displayed.
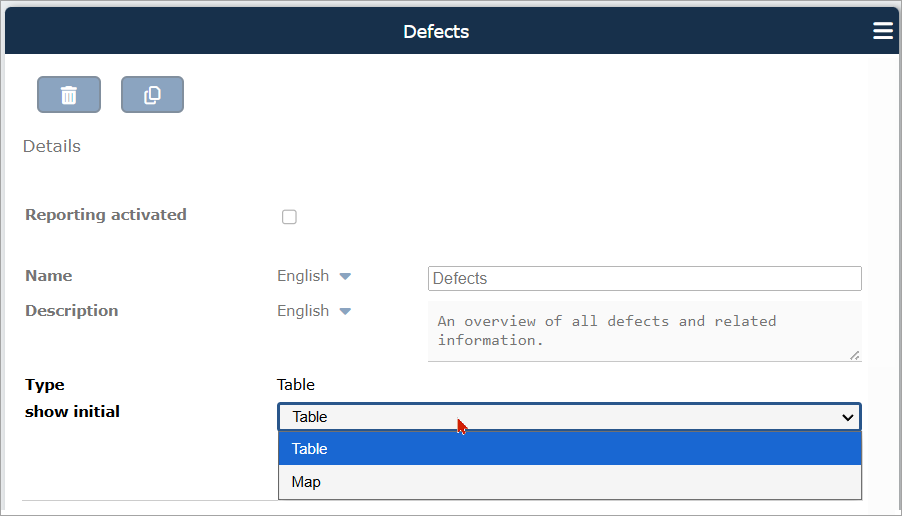
Select the display type "Table" if the analysis data should be displayed as a tabular list. This applies in most cases.
The display type "Map" is useful if you need a location map, for example to show the locations of the projects you manage in a clear overview.
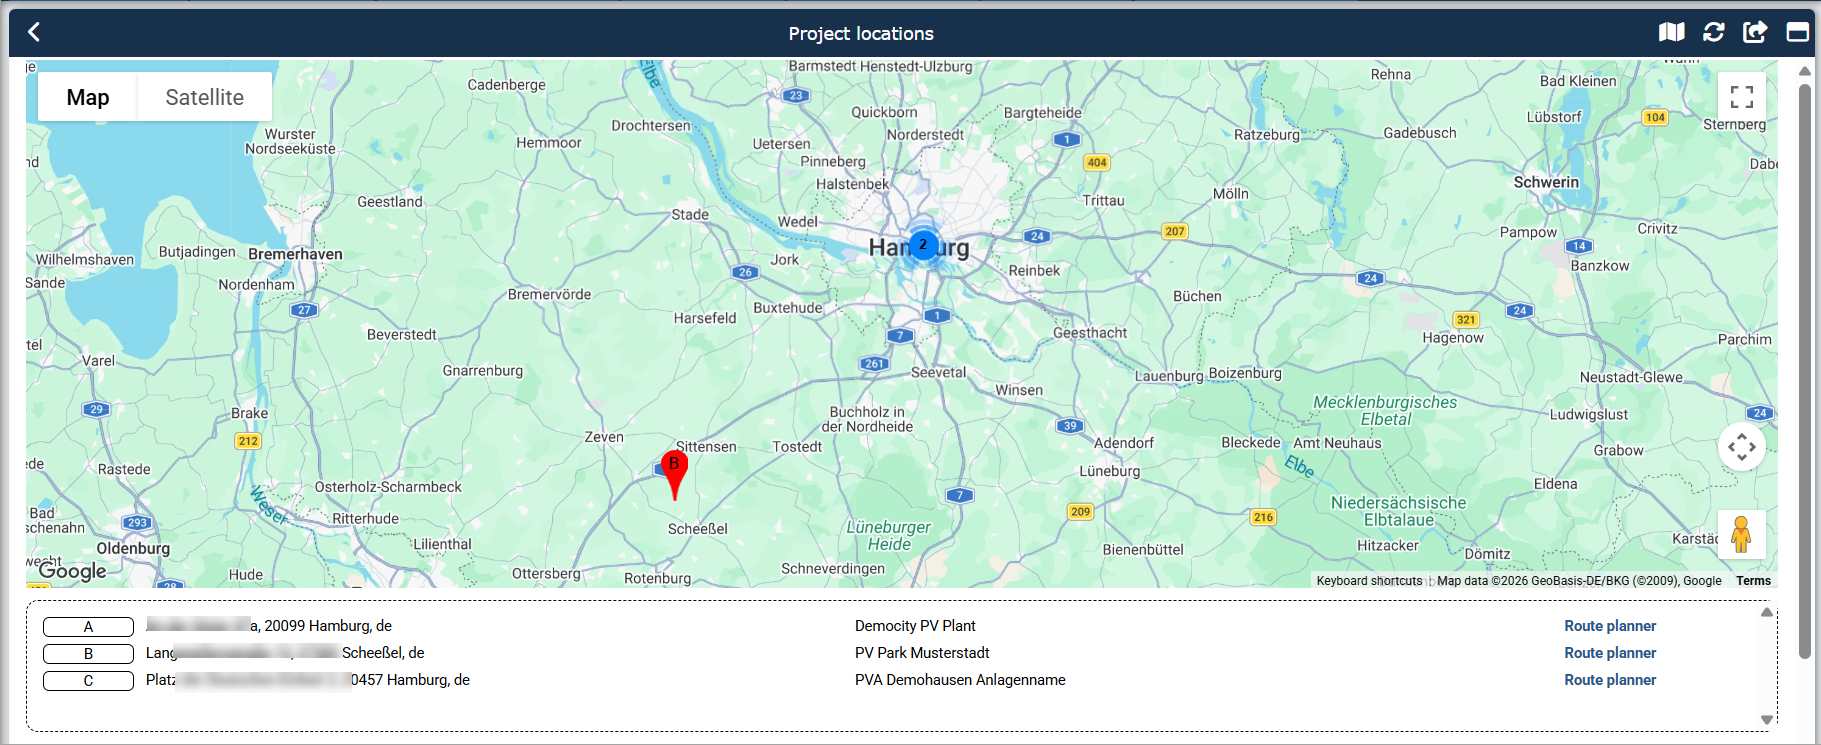
Users (Access to the analysis)
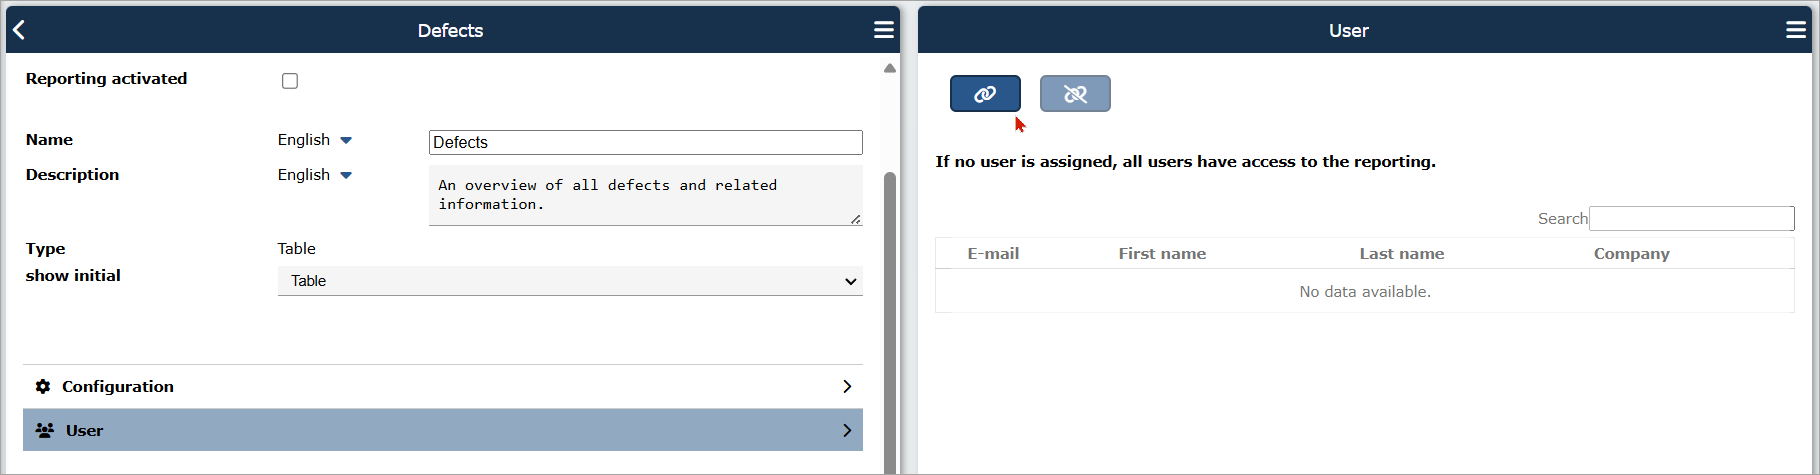
Using the "User" button in the configuration menu, you can restrict which TabTool users are allowed to see your analysis.
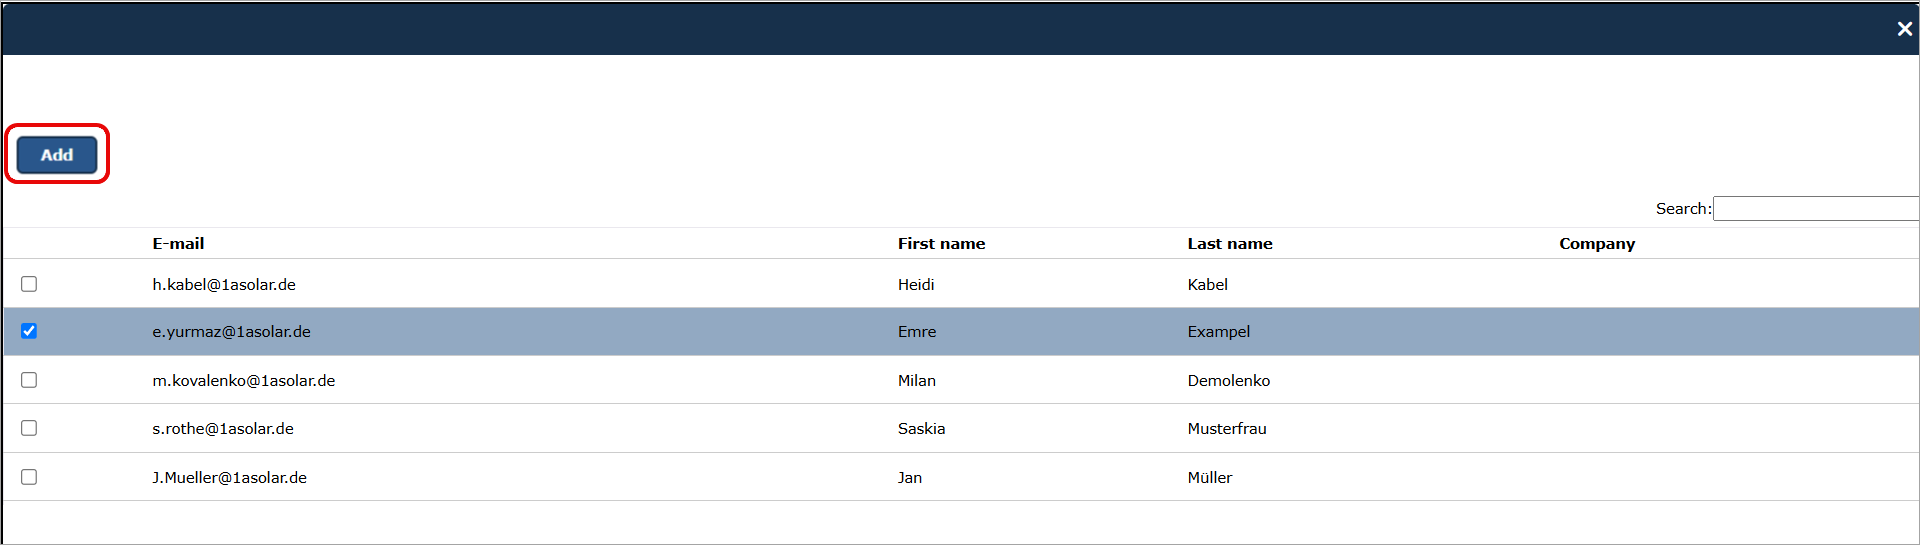
By default, newly created analyses are visible to all users in your TabTool package. If you want the analysis to be shown only to specific people, for example only to yourself as an administrator, you can use the button  to select the users who should have access.
Step 1:
Step 2:
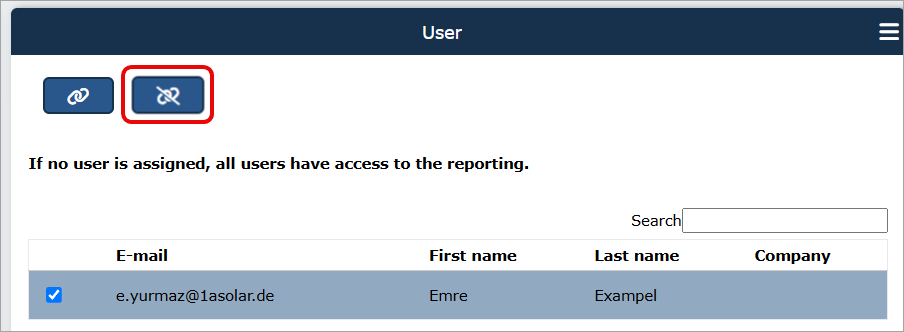
To remove access for a user, select the corresponding user entry and then click the button
Recalculate every night

Activate the "Recalculate every night" checkbox if the analysis should be recalculated automatically once a day. This gives you an up-to-date calculation status in the morning.
If this option is not activated, the analysis is only recalculated manually.
Show in Dashboard

Activate this checkbox if you want a pie chart of your analysis to be displayed in the analysis dashboard.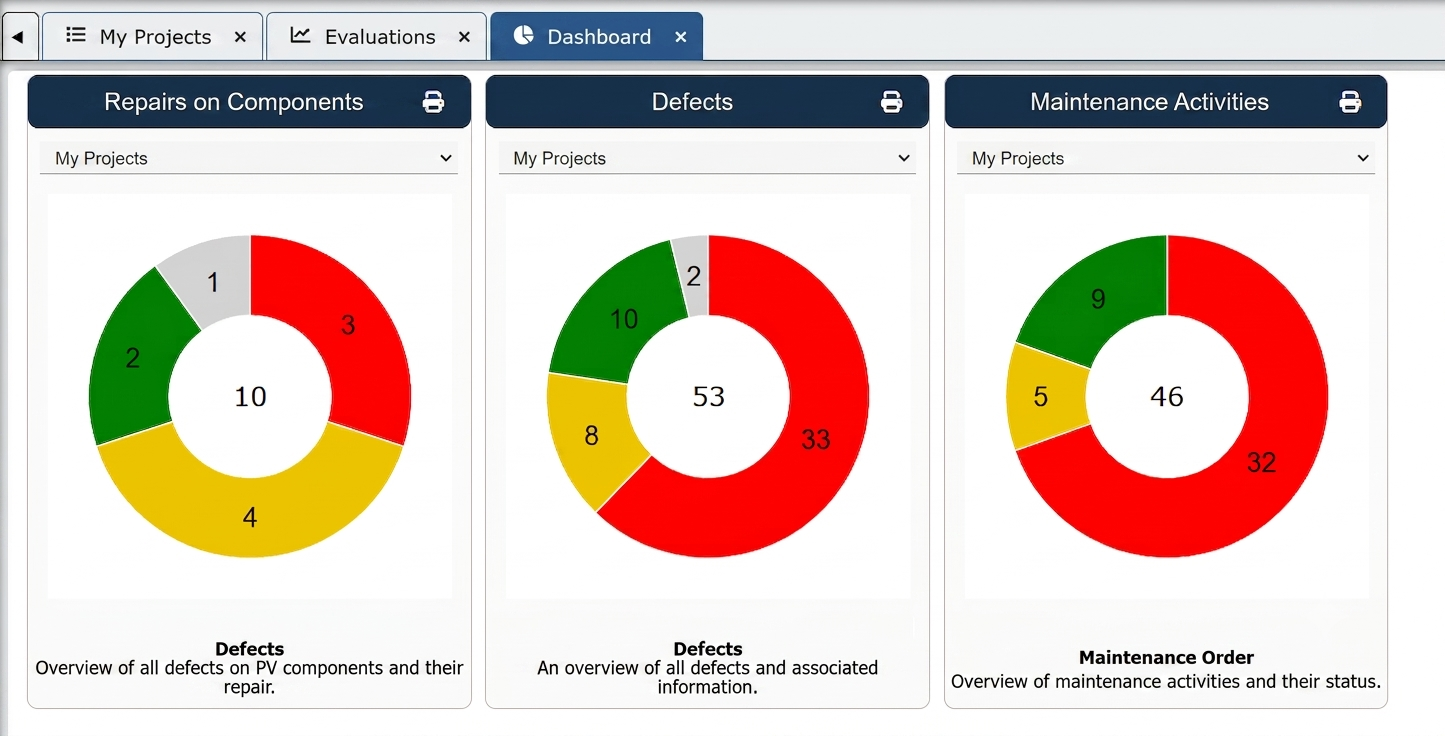
You can access this dashboard via the menu item "Analytics" in the main TabTool menu bar.
Show in TabTool App
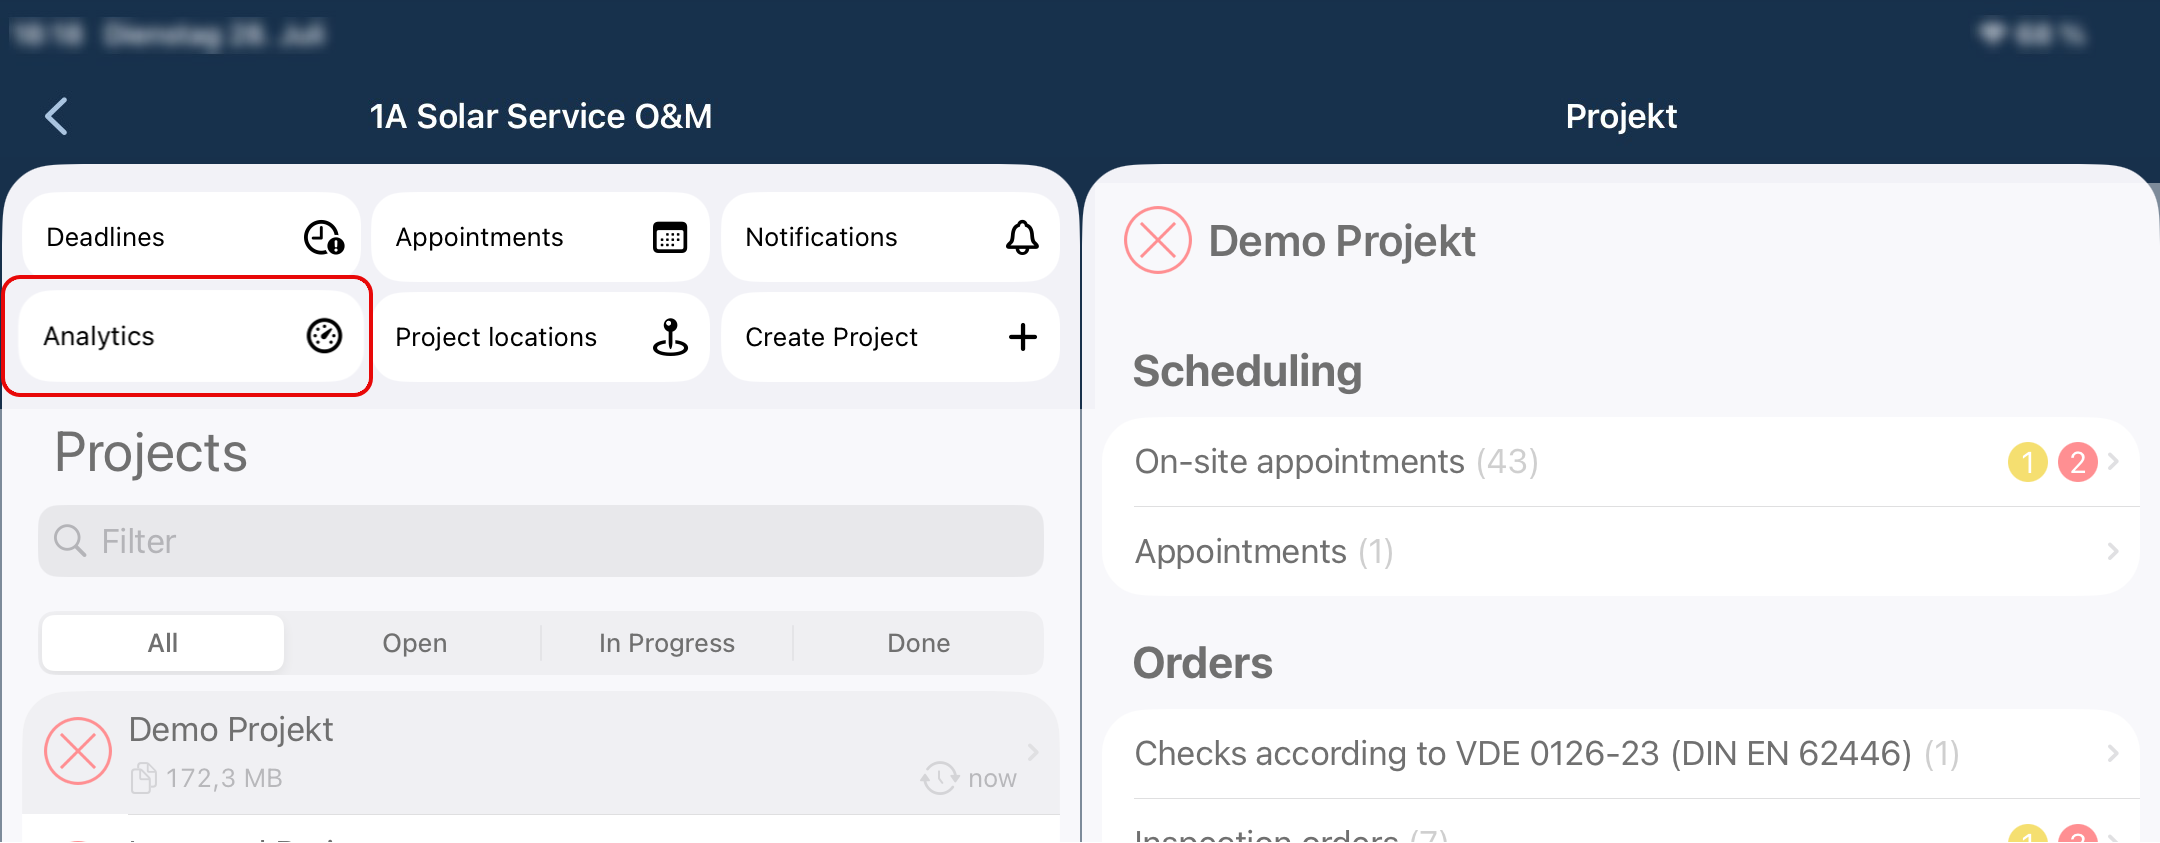
By default, analyses are only available in the TabTool Office web application. If you want users to be able to access an analysis via the TabTool app as well, activate this checkbox.
In the app, the analyses can then be opened using the "Analytics" button in the quick access menu. This is located directly above the list of projects.
Delete analyses
Analyses created by you or by other users can be deleted if required. To do this, click the button above the description of an analysis.
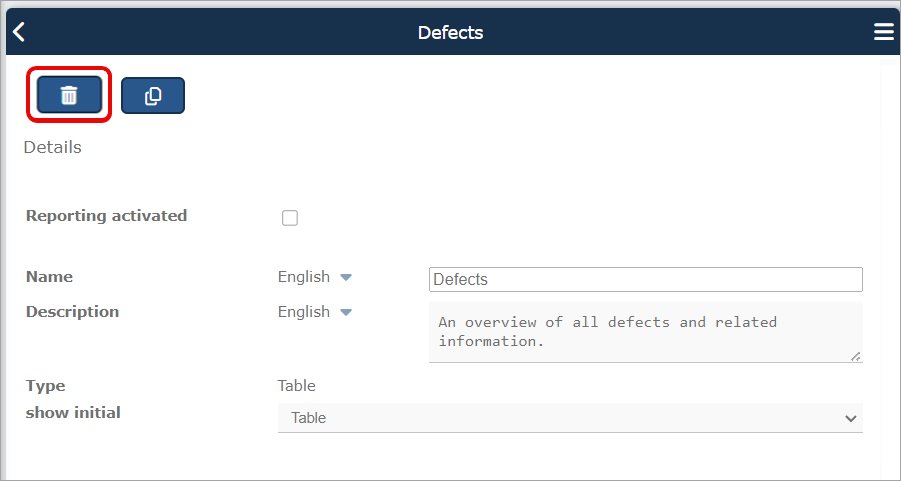
Analyses predefined by TabTool, however, cannot be deleted.
Using folders to structure analyses
If you work with many analyses, you can use folders to structure the list of your analyses more clearly in the "Manage analyses" area.
To do this, click the button above the analysis list.
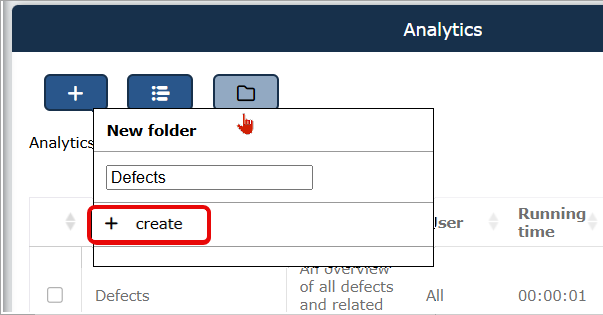
Enter the name of the folder in the text field and then click "+ create".
You can now create new analyses directly in the appropriate folder ...
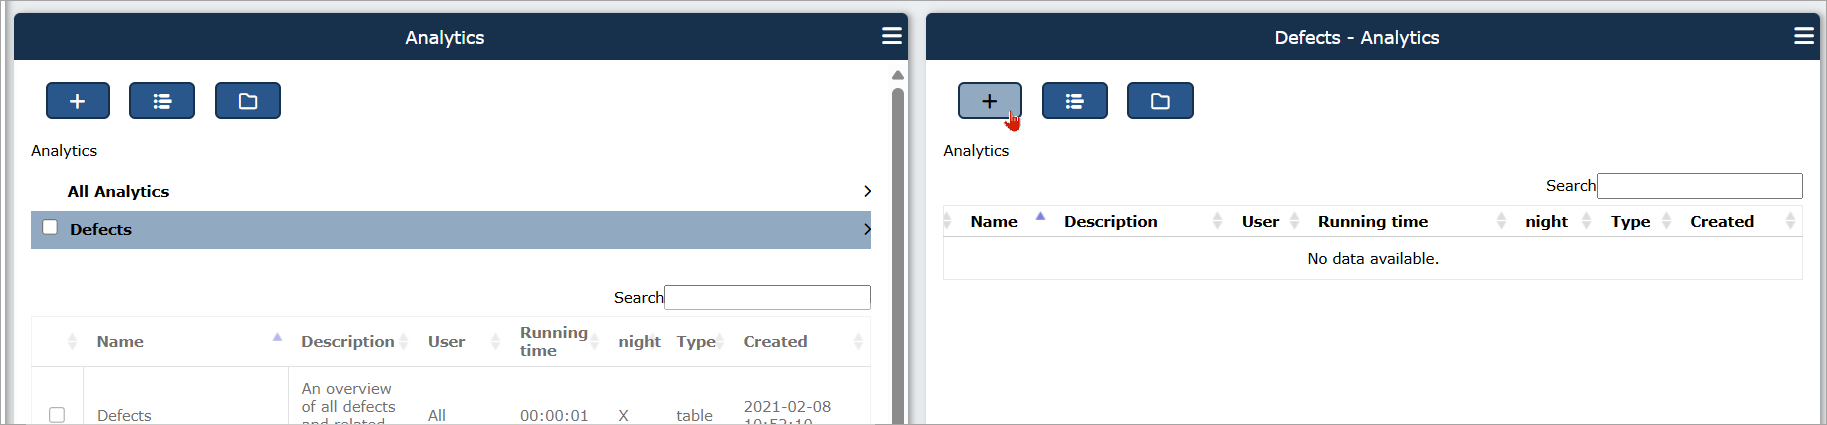
... or move existing analyses to the new folder. To do this, activate the checkbox(es) of the analysis or analyses you want to move in the list and then open the menu  at the top right of the toolbar.
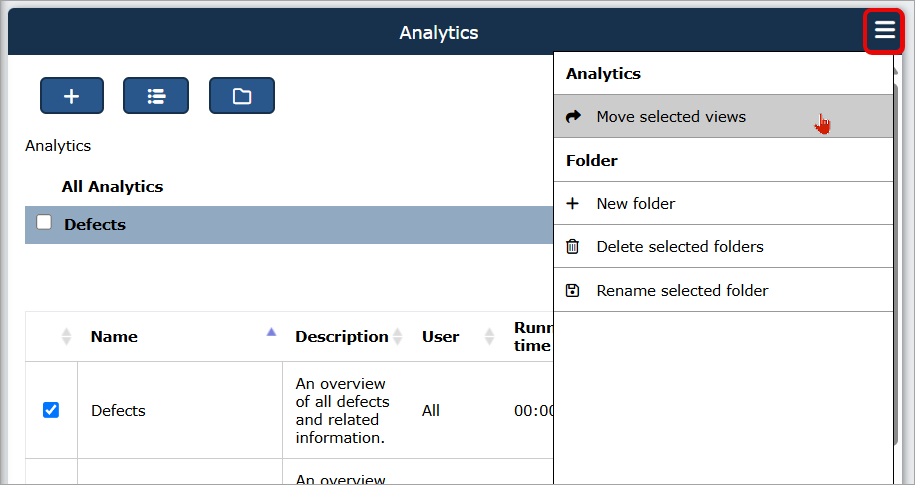
In the menu, click "Move selected views" to move the selected analyses to the new folder.
View, filter and recalculate analyses
To view analyses, click "My Analytics" under "Analytics" in the TabTool menu.
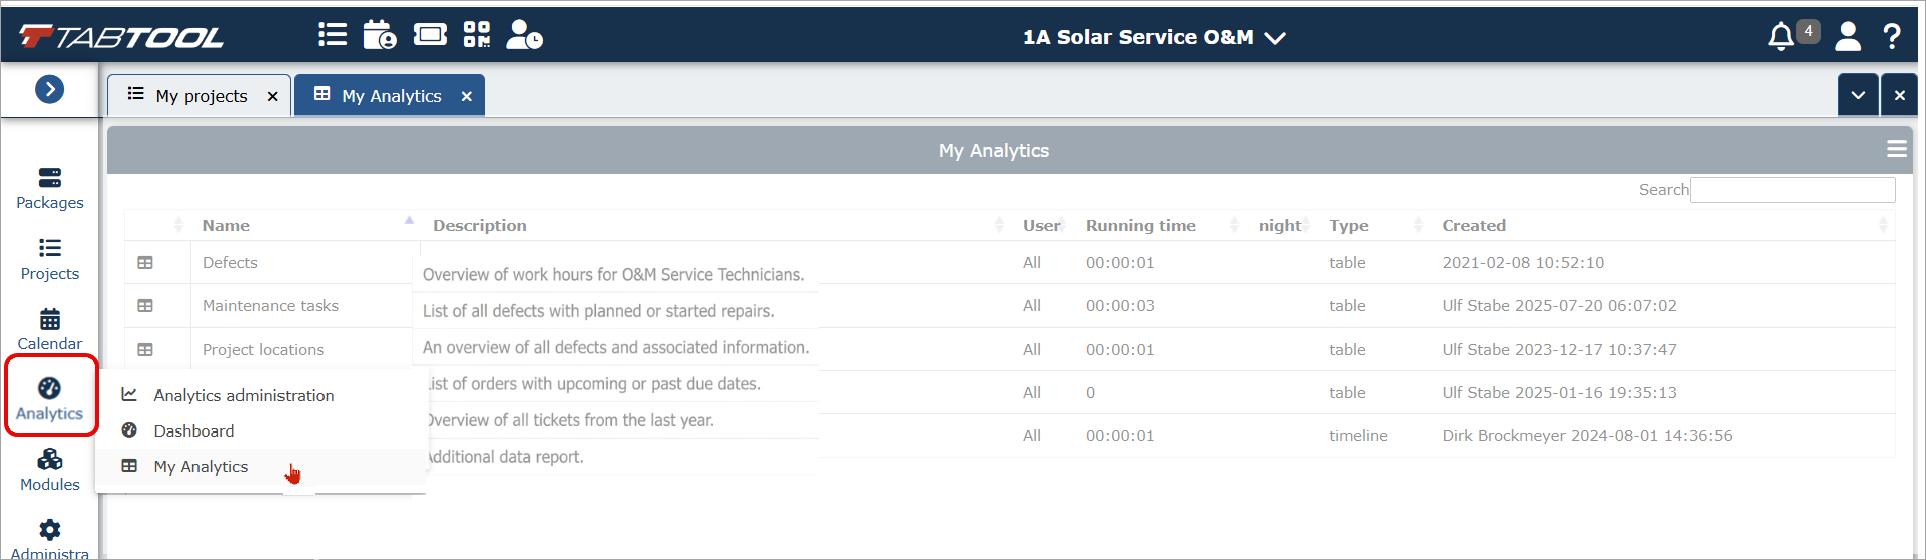
For more information, see the help article View, filter and recalculate analyses.
Was this article helpful?
That’s Great!
Thank you for your feedback
Sorry! We couldn't be helpful
Thank you for your feedback
Feedback sent
We appreciate your effort and will try to fix the article